Sampling Distribution of a Positively Skewed Population


Requires a Wolfram Notebook System
Interact on desktop, mobile and cloud with the free Wolfram Player or other Wolfram Language products.
This Demonstration is meant to help students understand how, based on the central limit theorem, the sampling distribution of a skewed population distribution will become normally distributed.
Contributed by: Scott R. Colwell (June 2011)
Open content licensed under CC BY-NC-SA
Snapshots


Details
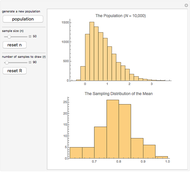
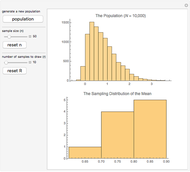
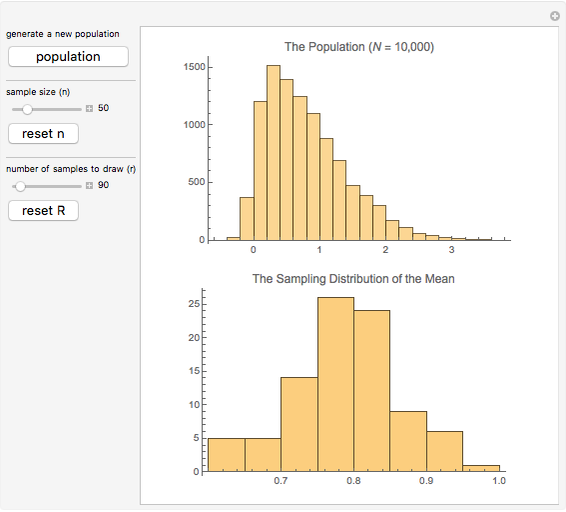
A population of the size  that is positively skewed is randomly generated when you click the "population" button. You can then change the "sample size",
  . This sets the size of a single sample that will be drawn from the population. You can then change the number of samples,
  . This sets the number of samples that will be drawn (of size
  ) from the population. For example, setting
  to 10 and
  to 50 means that you are drawing a sample of 10, 50 times. The mean for each sample is then calculated (e.g. 50 means) and plotted on the histogram, which represents the sampling distribution of the means. As per central limit theorem, as the sample size (the number of means, i.e. the number of samples) increases, the sampling distribution of the means will become more normally distributed even though the population distribution is skewed.
Permanent Citation
"Sampling Distribution of a Positively Skewed Population"
http://demonstrations.wolfram.com/SamplingDistributionOfAPositivelySkewedPopulation/
Wolfram Demonstrations Project
Published: June 24 2011
 Sampling Distribution of the Sample Mean
Jim R Larkin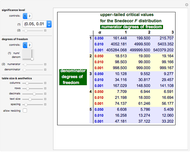 Upper-Tailed Critical Values of the Fisher-Snedecor Distribution
Jim R Larkin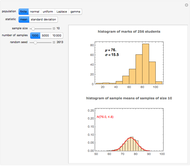 Sampling Distribution of the Mean and Standard Deviation in Various Populations
Ian McLeod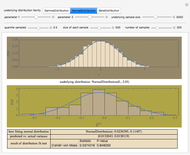 The Sampling Distribution of a Sampling Quantile
Seth J. Chandler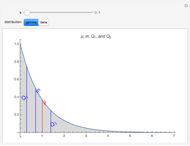 Mean, Median, and Quartiles in Skewed Distributions
Ian McLeod Distributions Using Slice Sampling
Oliver K. Ernst Distribution of the Sample Range of Continuous Random Variables
Heikki Ruskeepää Distribution of the Sample Range of Discrete Random Variables
Heikki Ruskeepää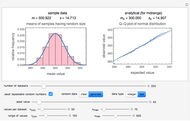 Distribution of the Means of Samples Having Random Sizes
Mark D. Normand, Joseph Horowitz, and Micha Peleg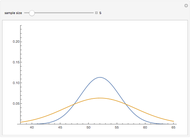 Distribution of Normal Means with Different Sample Sizes
David Gurney