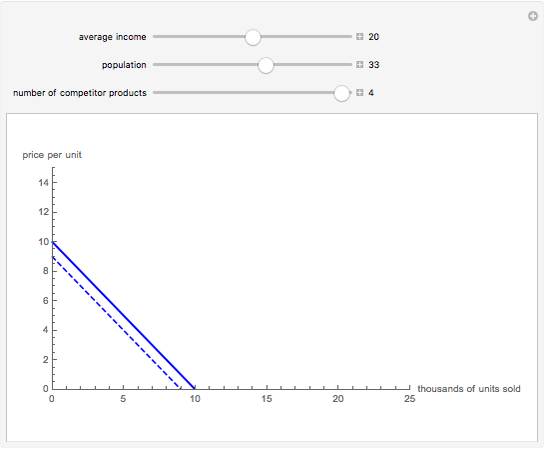
Shifts in the Demand Curve
Initializing live version


Requires a Wolfram Notebook System
Interact on desktop, mobile and cloud with the free Wolfram Player or other Wolfram Language products.
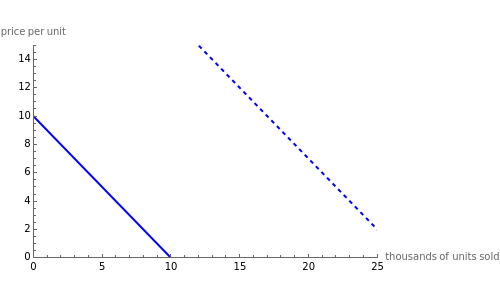
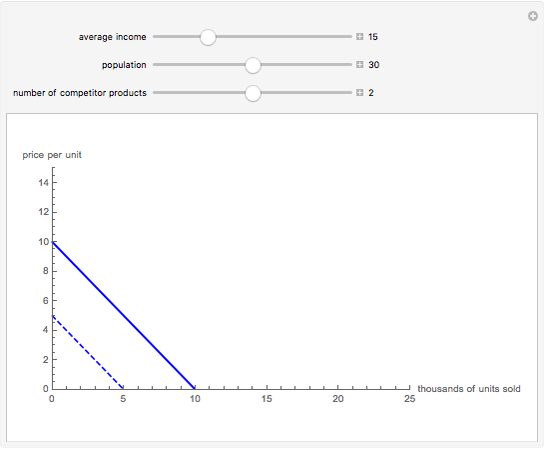
The solid blue line shown above is an arbitrary demand curve. This Demonstration shows how a few possible influences on demand shift the curve (dashed blue).
Contributed by: Sarah Lichtblau (March 2011)
Open content licensed under CC BY-NC-SA
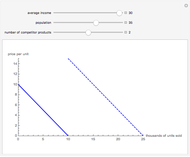
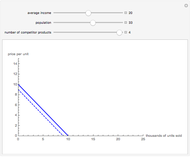
Snapshots


Details
detailSectionParagraphPermanent Citation
"Shifts in the Demand Curve"
http://demonstrations.wolfram.com/ShiftsInTheDemandCurve/
Wolfram Demonstrations Project
Published: March 7 2011
Related Demonstrations
More by Author
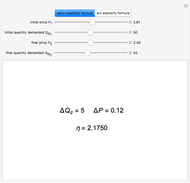 The Price Elasticity of Demand
Sarah Lichtblau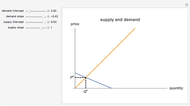 Basic Supply and Demand
Mark Gillis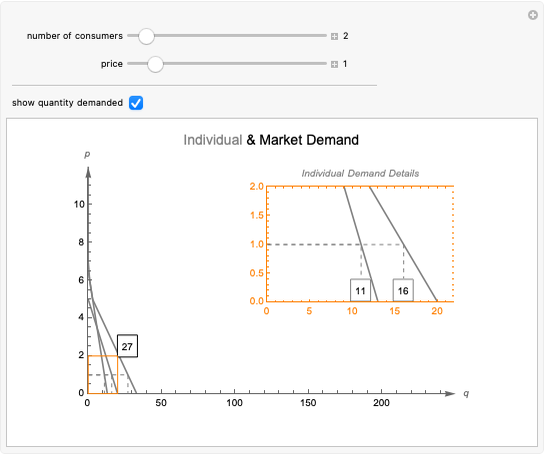 Individual versus Market Demand
Samuel G. Chen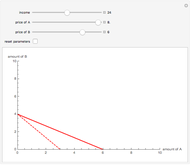 Changes in the Budget Line
Sarah Lichtblau Short-Run Cost Curves
William J. Polley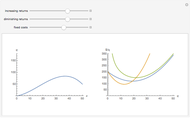 Short-Run Production and Cost Curves
Tom Creahan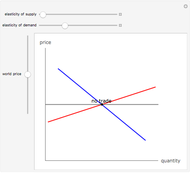 Gains from Trade
Fiona Maclachlan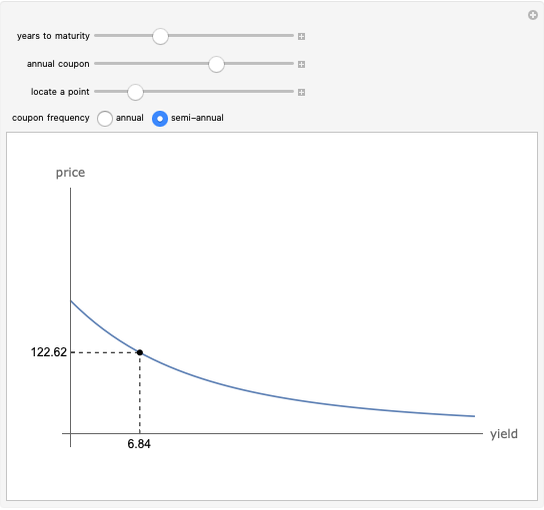 Price-Yield Curve
Fiona Maclachlan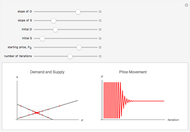 Cobweb Model
Samuel G. Chen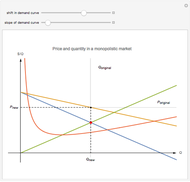 No Supply Curve in a Monopolistic Market
Samuel G. Chen
-
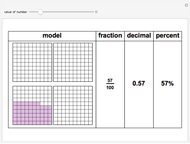 Comparing Fractions, Decimals, and Percents
Sarah Lichtblau -
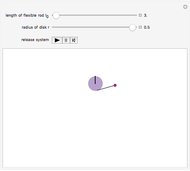
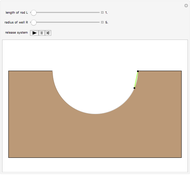
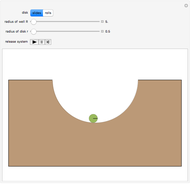 Disk Sliding or Rolling in a Semicircular Well
Sarah Lichtblau -
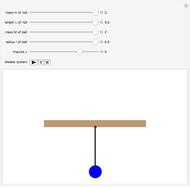
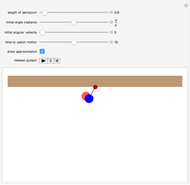 Nonlinearized Motion of a Simple Pendulum
Sarah Lichtblau -
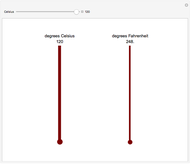 Celsius and Fahrenheit Thermometers
Sarah Lichtblau -
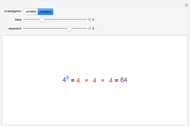 Integer Exponents
Sarah Lichtblau -
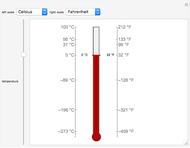 Comparing Temperature Scales
Sarah Lichtblau -
 Present Value Calculator
Sarah Lichtblau -
The Price Elasticity of Demand
Sarah Lichtblau -
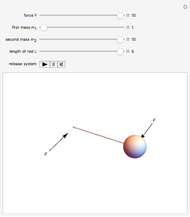
 Impulse Acting on a Pendulum
Sarah Lichtblau -
 Falling Mass Attached to a Rigid Pulley
Sarah Lichtblau -
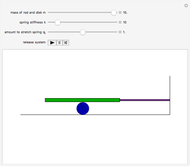 Motion of a Rolling Disk Driven by a Rod and Spring
Sarah Lichtblau -
 Motion of a Dumbbell Acted on by Constant Forces
Sarah Lichtblau -
 Falling Stick
Sarah Lichtblau -
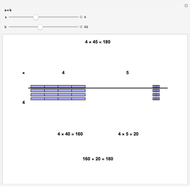 Multiplying a Double-Digit Number by a Single-Digit Number
Sarah Lichtblau -
 A Rod Sliding in a Semicircular Well
Sarah Lichtblau -
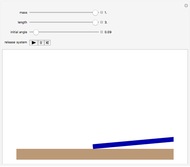
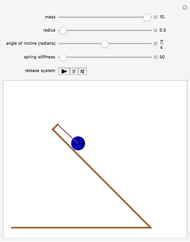 Motion of a Disk Hanging from a Spring on an Inclined Plane
Sarah Lichtblau -
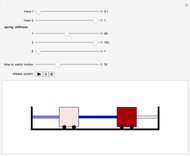 Motion of Two Masses Connected by Springs
Sarah Lichtblau -
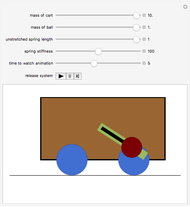 Motion of a System Consisting of a Rolling Cart, Pendulum, and Spring
Sarah Lichtblau -
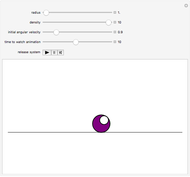 Rolling Cylinder with a Hole
Sarah Lichtblau -
 Nonsense Sentence Generator
Sarah Lichtblau