Individual versus Market Demand


Requires a Wolfram Notebook System
Interact on desktop, mobile and cloud with the free Wolfram Player or other Wolfram Language products.
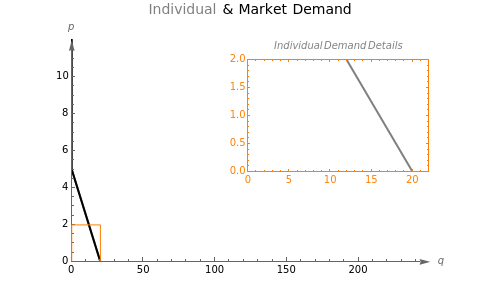
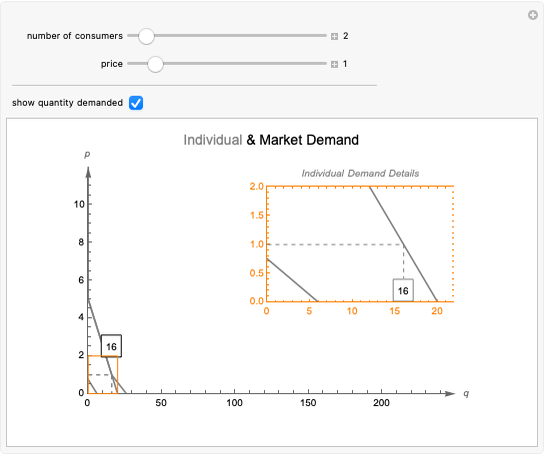
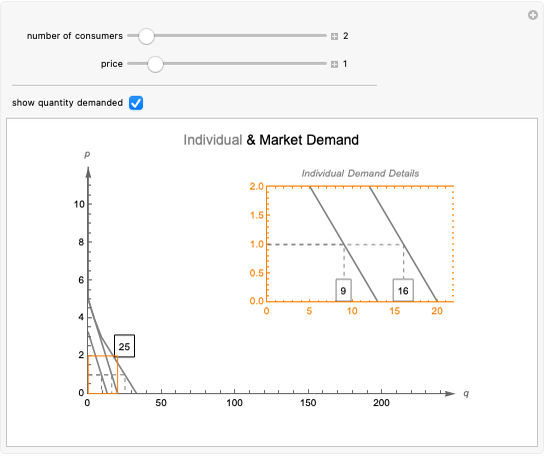
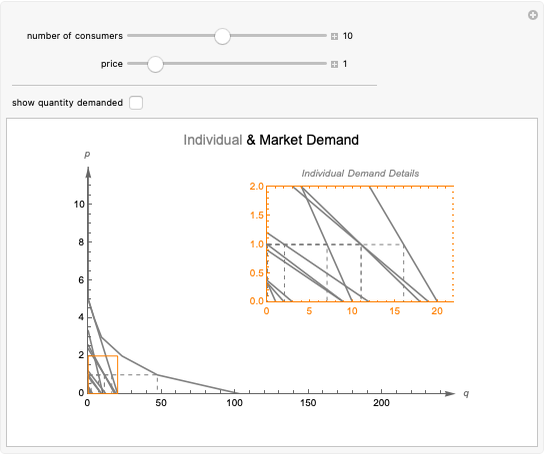
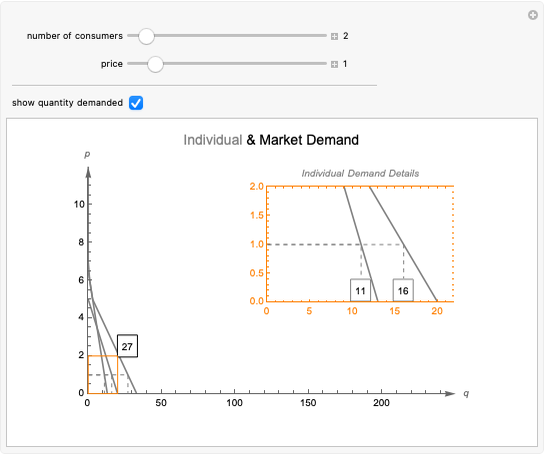
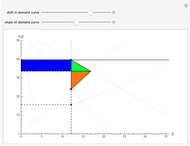
This Demonstration generates the horizontal sum of two consumers’ demand curves (gray) to generate a market demand curve (black). As you increases the number of consumers, the market demand curve changes accordingly. As you see, a nonlinear market demand curve can be generated from simple linear demand curves of individual consumers. Select the “show quantity demanded” button to see how the market demand is generated mathematically. It is a horizontal sum of all the individual demands in the market. The framed numbers show the individual quantities demanded and the sum of them is the market quantity demanded.
Contributed by: Samuel G. Chen (June 2011)
Open content licensed under CC BY-NC-SA
Details
Snapshots


Permanent Citation
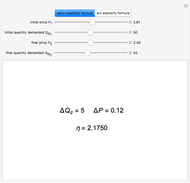 The Price Elasticity of Demand
Sarah Lichtblau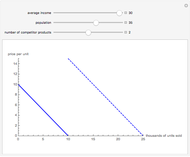 Shifts in the Demand Curve
Sarah Lichtblau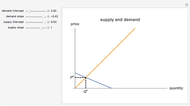 Basic Supply and Demand
Mark Gillis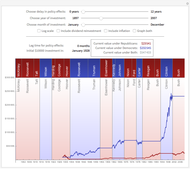 Stock Market Returns by Party
Theodore Gray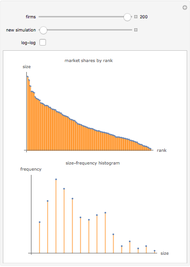 A Model of Market Shares II
Fiona Maclachlan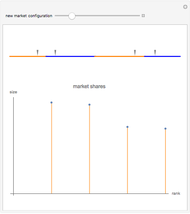 A Model of Market Shares I
Fiona Maclachlan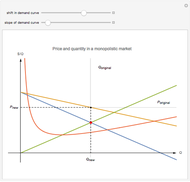 No Supply Curve in a Monopolistic Market
Samuel G. Chen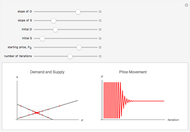 Cobweb Model
Samuel G. Chen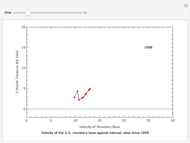 Spotting a Liquidity Trap
Samuel G. Chen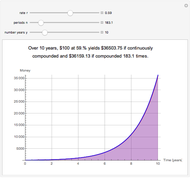 Continuous versus Compounded Interest
Jonathan Scherzer and Yossi Quint
-
 Individual versus Market Demand
Samuel G. Chen -
Spotting a Liquidity Trap
Samuel G. Chen -
Cobweb Model
Samuel G. Chen -
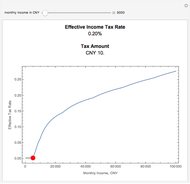 Expatriate Income Tax in China
Samuel G. Chen -
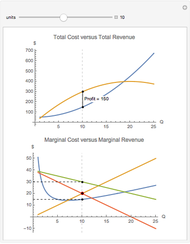 Monopolist's Profit Maximization
Samuel G. Chen -
No Supply Curve in a Monopolistic Market
Samuel G. Chen -
 Deadweight Loss for a Monopoly
Samuel G. Chen