Steady-State Operation of the Cardiovascular System


Requires a Wolfram Notebook System
Interact on desktop, mobile and cloud with the free Wolfram Player or other Wolfram Language products.
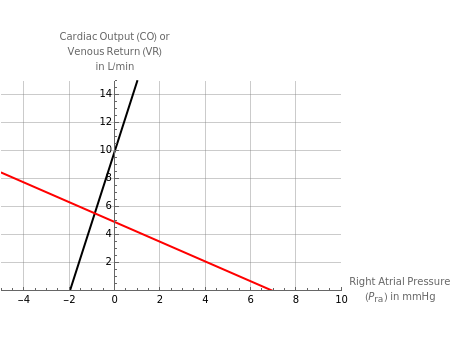
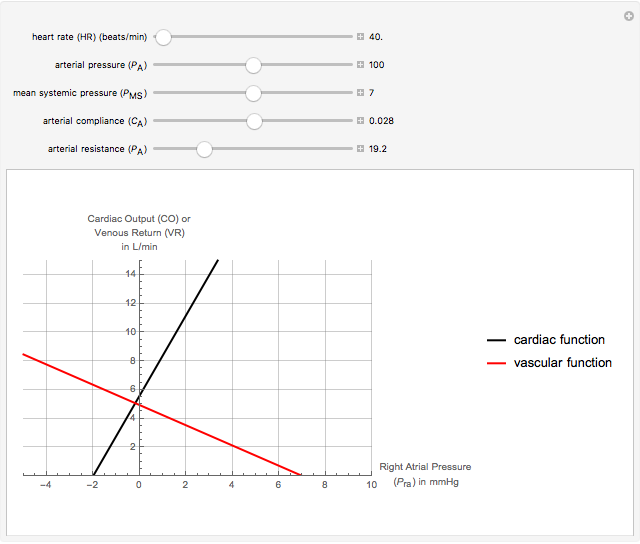
This Demonstration shows the steady-state operation of the cardiovascular system as represented by the point of intersection between the cardiac and vascular function curves. You can vary the controls to explore the effects of changing mechanical properties of the organs involved in cardiac function (e.g. arterial compliance).
Contributed by: Christopher B. Arena (April 2018)
Open content licensed under CC BY-NC-SA
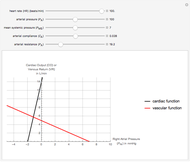
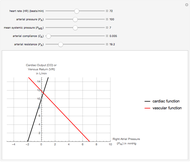
Snapshots


Details
Cardiac output ( ) describes the pumping ability of the heart [1]. It is directly proportional to right atrial pressure,
  , which also represents the preload. The preload controls the degree of stretch of the ventricle, and, according to the Frank–Starling law of the heart, increased preload and stretch ultimately increase the force of contraction and stroke volume. The equation for is:
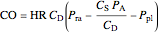 ,
,
where  is the heart rate in beats per minute,
  is the compliance of the heart during diastole,
  is the compliance of the heart during systole,
  is the arterial pressure, and
  is the pleural pressure.
Venous return ( ) is a reflection of the mechanical properties of the systemic circulation [1]. At steady-state,
  . The equation for is:
 ,
,
where  is the mean systemic pressure,
  and
and  are the resistance and compliance of the venous vasculature, respectively, and
  and
and  are the resistance and compliance of the arterial vasculature, respectively.
Snapshots 1 and 2 show the effects of increasing and decreasing heart rate, respectively. Snapshot 3 shows the effect of decreasing arterial compliance, as in the case of atherosclerosis.
Reference
[1] M. C. K. Khoo, Physiological Control Systems: Analysis, Simulation, and Estimation, New York: IEEE Press, 2000.
Permanent Citation
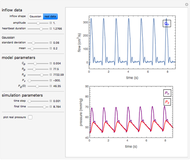 Windkessel Model for Hemodynamics in Arterial Systems
Mikel Landajuela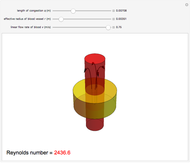 Factors Affecting Blood Flow
Juliet Foote and Mihir Surapaneni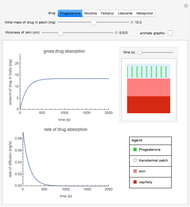 Transdermal Drug Delivery by Diffusion
Benjamin Pinsky and Elizabeth Le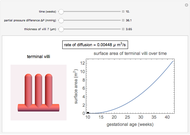 Diffusion of Oxygen through the Placenta
Colleen Tacubao, Patrick Chen and Hazel Wong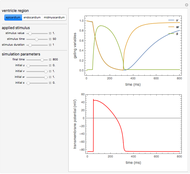 Heart Electrophysiology
Mikel Landajuela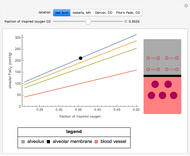 Effect of Altitude on Alveolar Oxygen Pressure
Natalie Gurevich and Kaitlyn Kuder
Ningxian "Nina" Fan and Daphne Cay Cantuba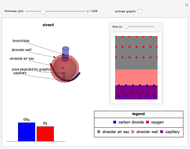 Simulating Gas Exchange in a Model of Pulmonary Fibrosis
Alexandra Peirce, Stephen Dowker and Sonia Parikh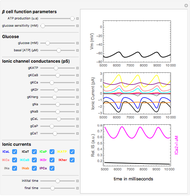 Model of Electrical Activity in Human Pancreatic Beta Cells
Gerardo J. Felix-Martinez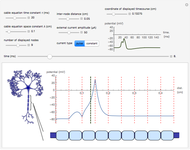 Action Potential Propagation along Myelinated Axons
Oliver K. Ernst
