Area of a Normal Distribution

Requires a Wolfram Notebook System
Interact on desktop, mobile and cloud with the free Wolfram Player or other Wolfram Language products.
To find  for a normally distributed random variable
  with mean
  and standard deviation
  we standardize values from the
  distribution using
  so that
  where
where  is a standard normal random variable. Such probabilities are represented as areas to the left of
  or
or  under a corresponding density curve.
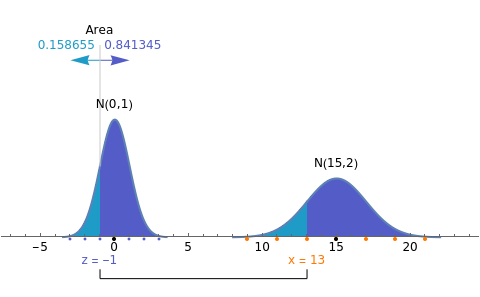
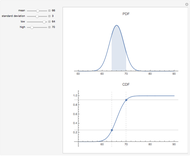
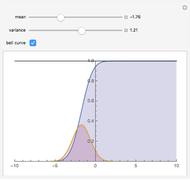
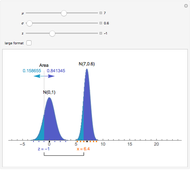
This Demonstration provides a visualization of the relationship between a normal distribution
  and the standard normal distribution
  . Specifically, the area to the left of the value
  in a
in a  distribution corresponds to an area to the left of the value's
  –score in a standard normal
  distribution. Likewise, the areas to the right of
  and
and  correspond to
  .
.
Contributed by: Eric Schulz (April 2007)
Open content licensed under CC BY-NC-SA
Snapshots
Details
detailSectionParagraphPermanent Citation
"Area of a Normal Distribution"
http://demonstrations.wolfram.com/AreaOfANormalDistribution/
Wolfram Demonstrations Project
Published: April 27 2007
