Visualizing the Gradient Vector
Initializing live version


Requires a Wolfram Notebook System
Interact on desktop, mobile and cloud with the free Wolfram Player or other Wolfram Language products.
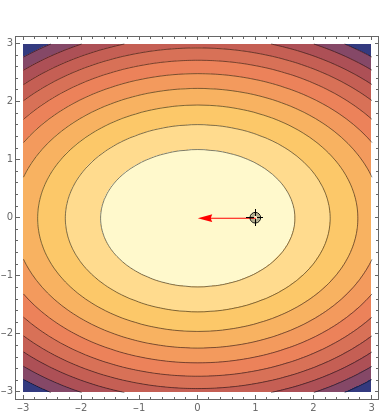
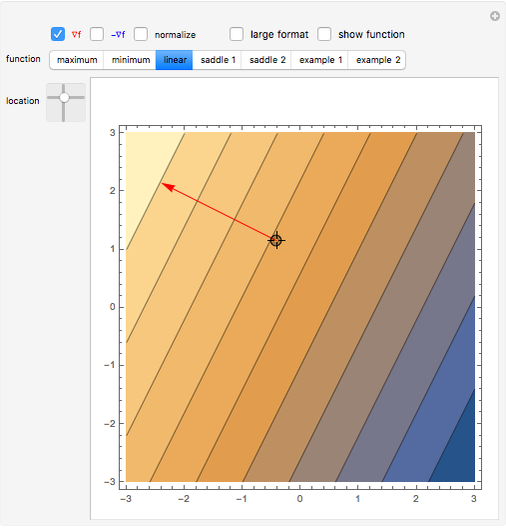
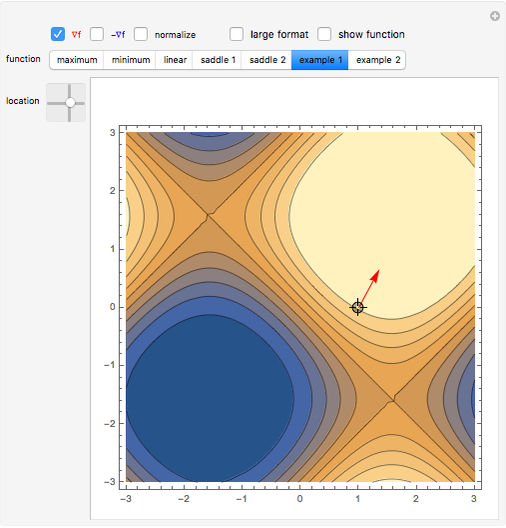
The gradient vector  evaluated at a point
  is superimposed on a contour plot of the function
  . By moving the point around the plot region, you can see how the magnitude and direction of the gradient vector change. You can normalize the gradient vector to focus only on its direction, which is particularly useful where its magnitude is very small.


Contributed by: Eric Schulz (March 2011)
Open content licensed under CC BY-NC-SA
Snapshots

Details
Permanent Citation
Related Demonstrations
More by Author
 Surfaces and Gradients
Nevin Raj Tangent to a Surface
Jeff Bryant and Yu-Sung Chang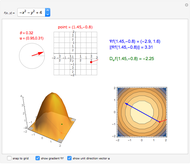 Directional Derivatives
Abby Brown (Torrey Pines High School) Swirl and the Curl
Michael Rogers Tangent Planes on a 3D Graph
Drew Kozicki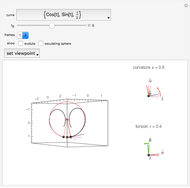 Curvature and Torsion
Michael Rogers (Oxford College/Emory University)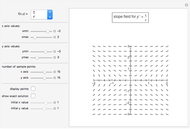 Slope Fields
Charles E. Oelsner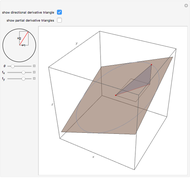 Directional Derivatives and the Gradient
Bruce Torrence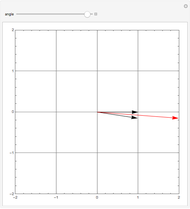 Vector Addition in a Plane
Connor Adrian Glosser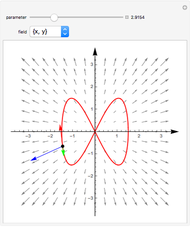 Vector Field Acting on a Curve
Connor Glosser
-
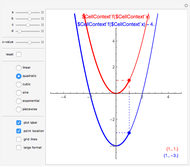 Function Transformations
Eric Schulz -
 Transformación de funciones (Spanish)
Eric Schulz -
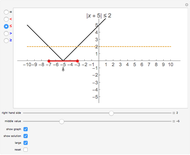 Number Line Solutions to Absolute Value Equations and Inequalities
Eric Schulz -
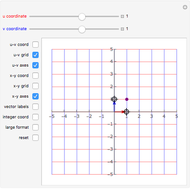 Coordinates of a Point Relative to a Basis in 2D
Eric Schulz -
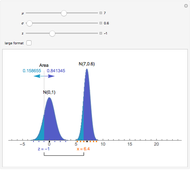 Area of a Normal Distribution
Eric Schulz -
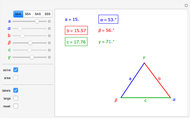 Solving Oblique Triangles
Eric Schulz -
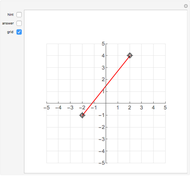 Distance between Two Points
Eric Schulz -
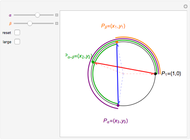
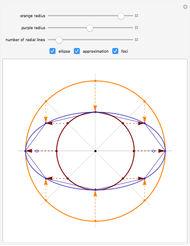 Drawing an Ellipse Using Circles and Lines
Eric Schulz -
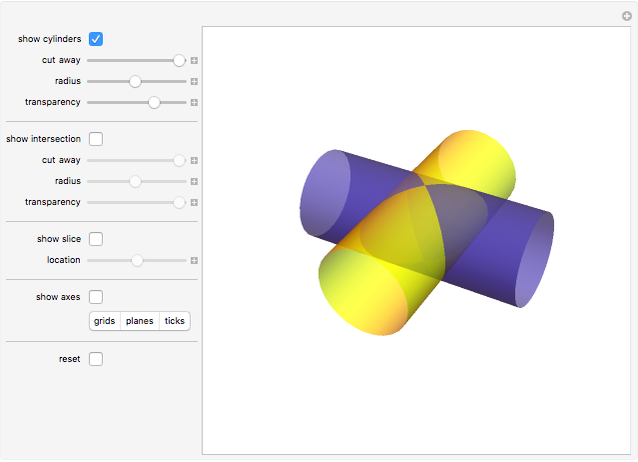 Intersection of Two Cylinders
Eric Schulz -
 A Proof of the Difference Identity for Cosine
Eric Schulz -
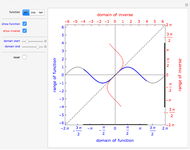 Domain and Range of Inverse Trigonometric Functions
Eric Schulz -
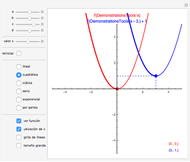
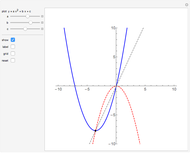 How Does the Vertex Location of a Parabola Change?
Eric Schulz -
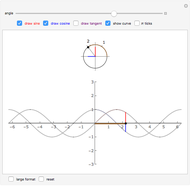 Sine, Cosine, Tangent and the Unit Circle
Eric Schulz -
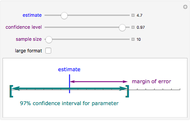 Confidence Intervals: Confidence Level, Sample Size, and Margin of Error
Eric Schulz -
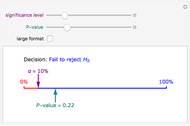 Decisions Based on P-Values and Significance Levels
Eric Schulz -
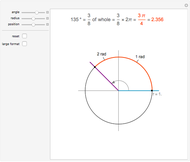 Angles Measured in Degrees and Radians
Eric Schulz -
 Visualizing the Gradient Vector
Eric Schulz