Complex Zeros of Quadratic Functions


Requires a Wolfram Notebook System
Interact on desktop, mobile and cloud with the free Wolfram Player or other Wolfram Language products.
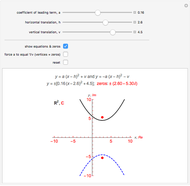
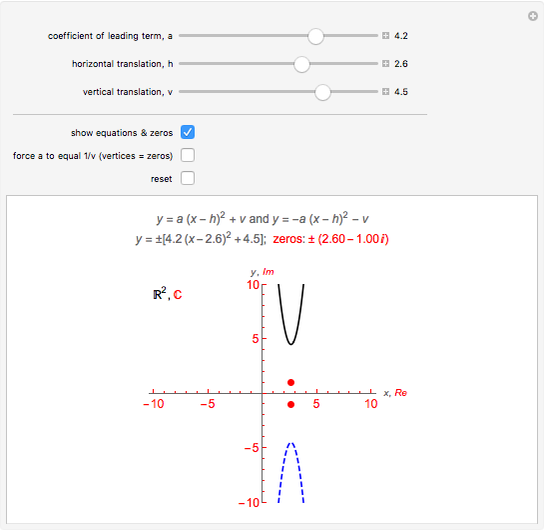
This Demonstration shows the graphs of two symmetric quadratic functions (with respect to the  axis) of the form
  and
and  , where
  and
and  are the horizontal and vertical translations of the corresponding parabolas
  and
and  , with vertices at the origin. Their complex zeros are identical and marked by red dots located in the complex plane
  , where the
  and
and  axes (labeled in red on the graph) coincide with the Cartesian plane
  coordinate and
  axes; that is, the axis is also the real axis and the axis is also the imaginary axis. While any real zeros lie on the axis (or real axis), imaginary zeros come in pairs (complex conjugates) and lie on the vertical line
  that runs through the vertices (and foci) of the parabolas. Further, as complex conjugates, the zeros are symmetric with respect to the axis (real axis). To see the effects on the graph when
  , click on the checkbox "force
  to equal
  (vertices = zeros)" and move the slider.
Contributed by: Barry Cherkas (March 2011)
(Hunter College and WebGraphing.com)
Open content licensed under CC BY-NC-SA
Snapshots


Details
To find the complex zeros, set  in each equation,
  and , and solve for :
  and
and  , which implies (in either case)
  ,
,  ,
,  ,
,  . When
  , the zeros are real and lie on the axis; when
  , there are two imaginary zeros (complex conjugates) that lie on the vertical line . For and fixed vertices
  , observe that: (1) as
  , the parabolas get narrower while the imaginary zeros approach the real axis along the line ; and (2) as
  , the parabolas flatten out while the imaginary zeros approach ±
 along the line . When and the imaginary part of either imaginary zero is the same as , that is when
  , both imaginary zeros coincide with the vertices. To solve , square both sides and get
  , which has solution .
Permanent Citation
 Complex Quadratic Residues
Ed Pegg Jr Locating the Complex Roots of a Quadratic Equation
Jaime Rangel-Mondragon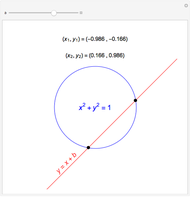 Visible and Invisible Intersections in the Cartesian Plane
S. M. Blinder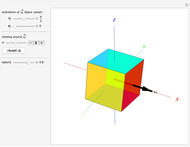 Rotating a Cube Using Quaternions
Gerard Balmens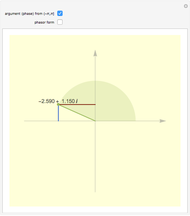 Complex Number
?tefan Porubský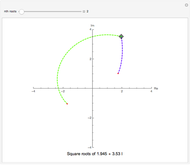 Powers of Complex Roots
Eliot Ball Visualizing Complex-Valued Functions Using RGB Values
Izidor Hafner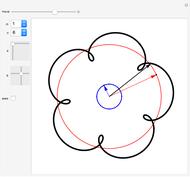 Functions in Two-Dimensional Vector Space or Complex Plane
Izidor Hafner Patterns from Math Rules Using Complex Numbers
Daniel de Souza Carvalho The Parabola's Evil Twin: Real and Nonreal Roots of a Real Quadratic
Phil Ramsden