Continuous Binomial Function in 3D


Requires a Wolfram Notebook System
Interact on desktop, mobile and cloud with the free Wolfram Player or other Wolfram Language products.
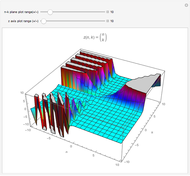
This is a 3D plot of the binomial function, based on using the gamma function to extend the definition of  from the integers to real numbers.
Contributed by: Larry Kealey (March 2011)
Open content licensed under CC BY-NC-SA
Snapshots


Details
The controls let you set the range visible for the  -
- plane as well as the height of the
  axis.
axis.
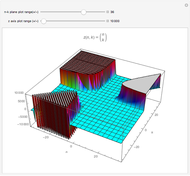
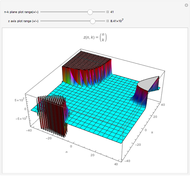
The "n-k plane plot range" slider lets you expand  to
to  . Both are expanded or contracted together.
The "z axis plot range" slider lets you expand  to
to  . As the range can be adjusted by eight orders of magnitude, it is often easier to open the control and type in the desired value.
See section 4.6, A New View of Pascal’s Triangle of [2].
references:
[1] D. Fowler, "The Binomial Coefficient Function," American Mathematical Monthly, 103(1), 1996 pp. 1–17.
[2] S. Wagon, Mathematica in Action, New York: Springer, 2010.
Permanent Citation
 Binomial Theorem (Step-by-Step)
Bruce Colletti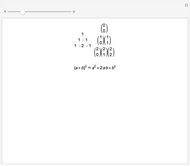 Pascal's Triangle and the Binomial Theorem
Pablo Alberca Bjerregaard (University of Malaga, Spain) Function Explorer 3D
Ed Pegg Jr PolyLog Function
Enrique Zeleny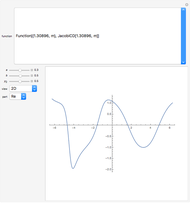 Elliptic Functions
Enrique Zeleny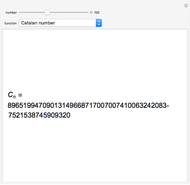 Values of Combinatorial Functions
Jeff Bryant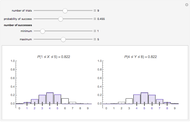 Successes and Failures in a Run of Bernoulli Trials
Chris Boucher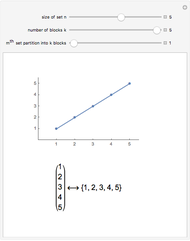 Set Partitions Match Restricted Growth Functions
George Beck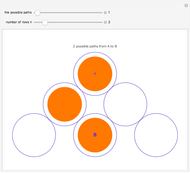 Counting Paths through a Grid
George Beck and Rob Morris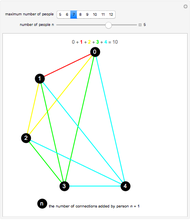 Number of Handshakes
Bob Hanlon