Exploring Minimal Models of the Complexity of Security Prices

Requires a Wolfram Notebook System
Interact on desktop, mobile and cloud with the free Wolfram Player or other Wolfram Language products.
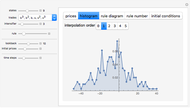
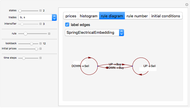
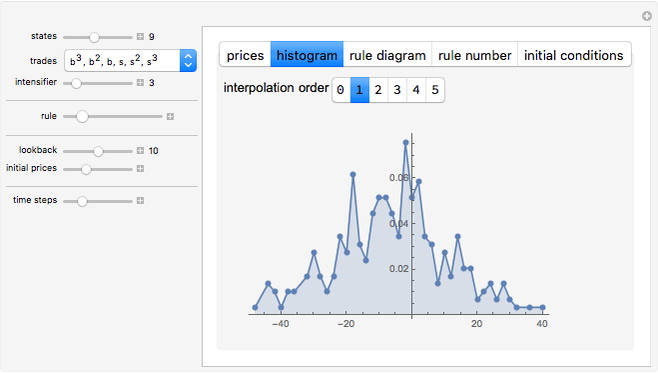
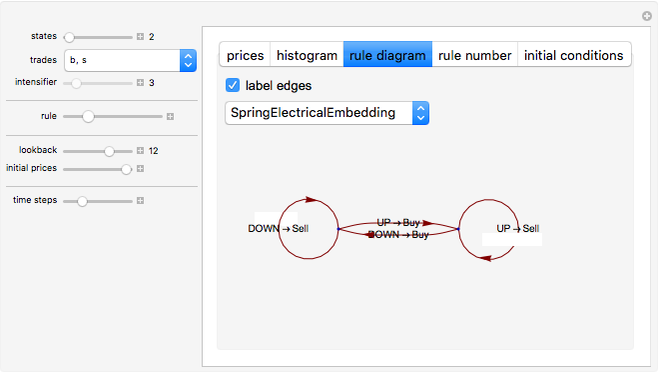
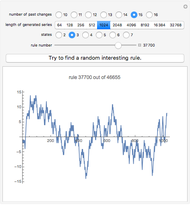
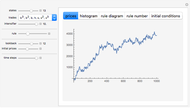
You are tuning your trader, who will be the representative investor on a single financial security. He decides what to do by looking at the history of price changes for the past few days, following some specific rule. You pick the number of states your trader has, his possible trading decisions, and his exact rule. Hover the mouse over any of the control labels for more information.
Contributed by: Philip Maymin (March 2011)
Open content licensed under CC BY-NC-SA
Snapshots


Details
Try to find interesting rules by playing with the parameters. Is it easier to find complex rules by looking at the time series plot, the histogram, or the rule diagram?
For more information, consult this overview or search for the other related Demonstrations.
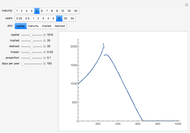
 Minimal Model of Simulating Prices of Financial Securities Using an Iterated Finite Automaton
Philip Maymin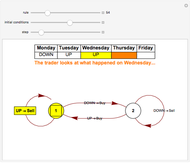 Trader Dynamics in Minimal Models of Financial Complexity
Philip Maymin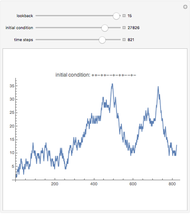 The Minimal Model of the Complexity of Financial Security Prices
Philip Maymin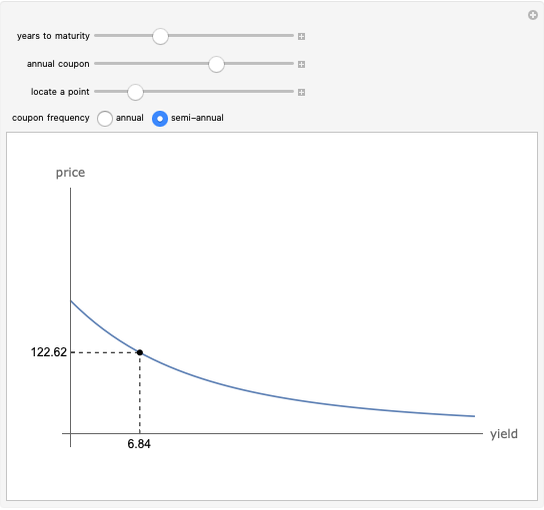 Price-Yield Curve
Fiona Maclachlan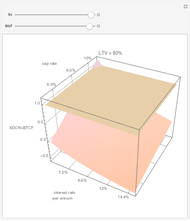 Explaining Real Estate Price Bubbles
Roger J. Brown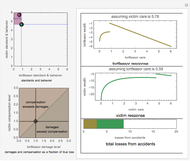 Bilateral Accident Model
Seth J. Chandler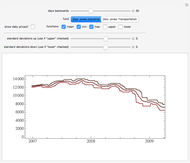 Stock Price Envelopes
Seth J. Chandler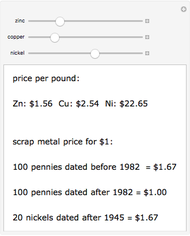 Scrap Metal Price of Coins
Ed Pegg Jr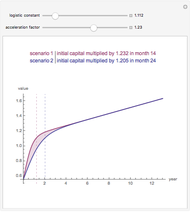 Value Added Growth Model
Roger J. Brown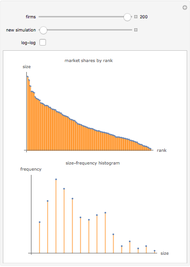 A Model of Market Shares II
Fiona Maclachlan
-
Minimal Model of Simulating Prices of Financial Securities Using an Iterated Finite Automaton
Philip Maymin -
 The Hazards of Propping Up: Bubbles and Chaos
Philip Maymin -
Trader Dynamics in Minimal Models of Financial Complexity
Philip Maymin -
The Minimal Model of the Complexity of Financial Security Prices
Philip Maymin -
 Exploring Minimal Models of the Complexity of Security Prices
Philip Maymin