Hénon Map Visualization
Initializing live version


Requires a Wolfram Notebook System
Interact on desktop, mobile and cloud with the free Wolfram Player or other Wolfram Language products.
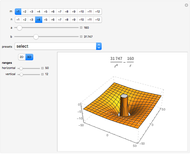
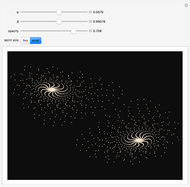
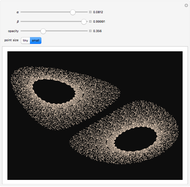
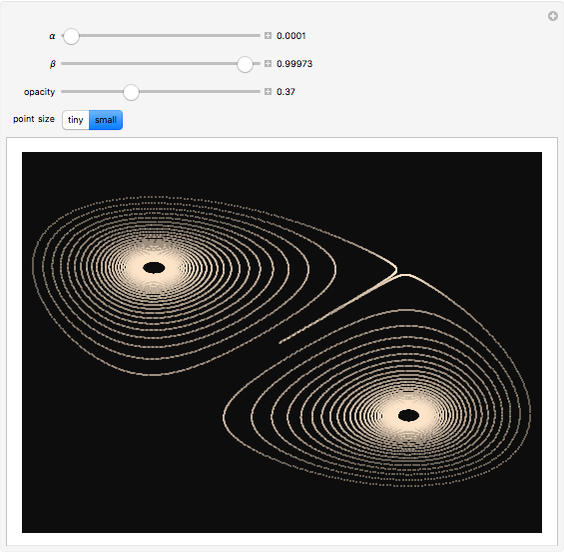
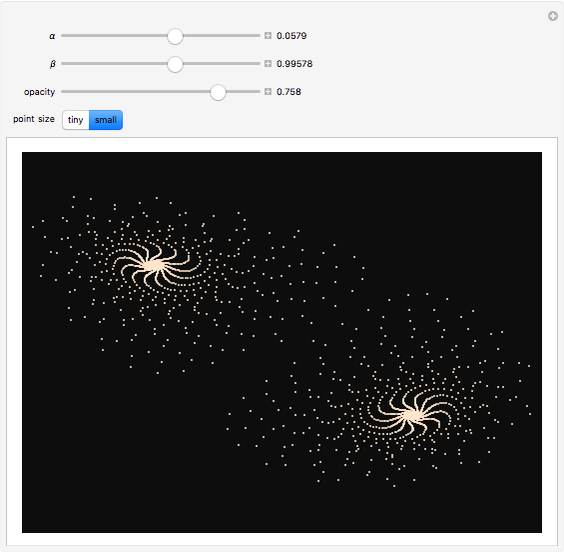
This Demonstration plots the first 20000 iterates of the Hénon map from initial condition  within a limited range of the parameters (
 and
and  ). You can vary the parameter
  between 0.0001 and 0.1 and the parameter
  between 0.99 and 0.99999.
Contributed by: Stefan Ganev (March 2011)
Open content licensed under CC BY-NC-SA
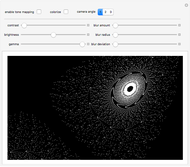
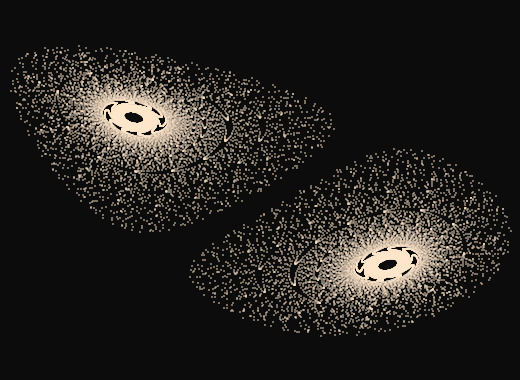
Snapshots

Details
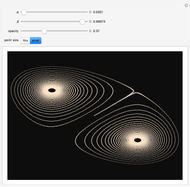
The equations for the Hénon map used here are 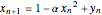 and
and  with initial conditions
  ,
,  , and 20000 iterations.
Permanent Citation
Related Demonstrations
More by Author
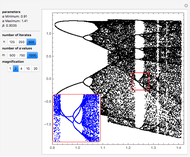 Bifurcation Diagram of the Hénon Map
Erik Mahieu Classic Logistic Map
Robert M Lurie Orbits of the Hopalong Map
Erik Mahieu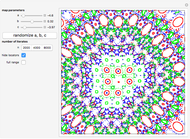 Orbits of Martin's Map
Erik Mahieu Orbits of the Gingerbreadman Map
Erik Mahieu Variations of the Gingerbreadman Map
Erik Mahieu Three Views of the Logistic Map
Hiroki Sayama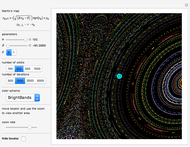 Martin's Map Artwork
Erik Mahieu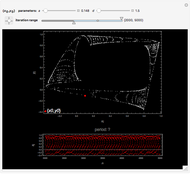 Iterations of Kaneko Map
Erik Mahieu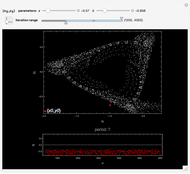 Iterations of Strick Map
Erik Mahieu