Variations of the Gingerbreadman Map

Requires a Wolfram Notebook System
Interact on desktop, mobile and cloud with the free Wolfram Player or other Wolfram Language products.
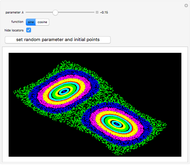
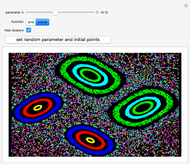
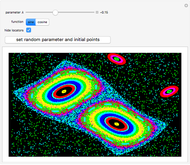
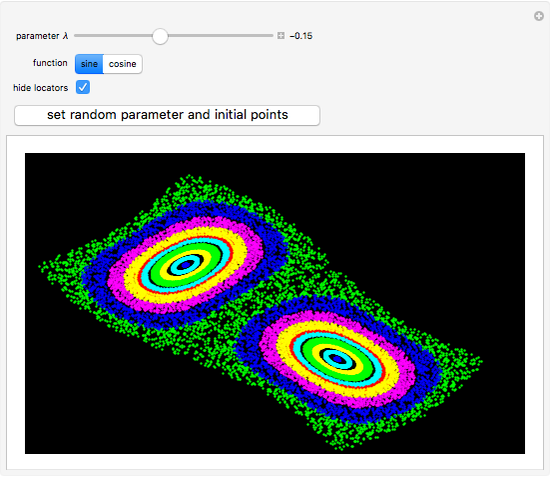
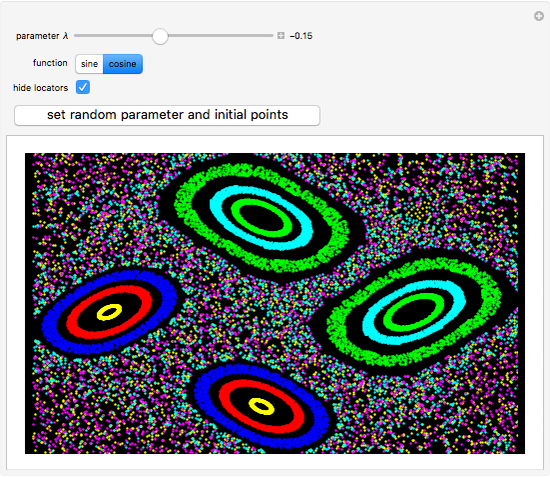
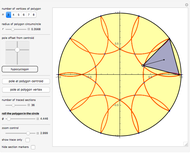
This Demonstration plots orbits of the two-dimensional iterative map (a variation of the gingerbreadman map):  ,
,  . The orbits are generated by iterating the map 3000 times using different initial points. Six orbits are plotted initially, starting from positions marked by the locator objects "
 ". You can drag these initial points or add and/or delete new ones inside the plot. Each orbit is colored differently and the colors are repeated cyclically.
Contributed by: Erik Mahieu (March 2011)
Open content licensed under CC BY-NC-SA
Snapshots

Details
detailSectionParagraphPermanent Citation
"Variations of the Gingerbreadman Map"
http://demonstrations.wolfram.com/VariationsOfTheGingerbreadmanMap/
Wolfram Demonstrations Project
Published: March 7 2011
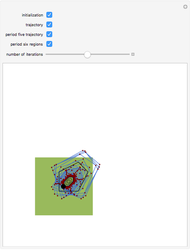 Gingerbreadman Trajectories
Michael Schreiber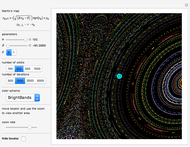 Martin's Map Artwork
Erik Mahieu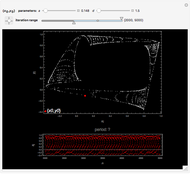 Iterations of Kaneko Map
Erik Mahieu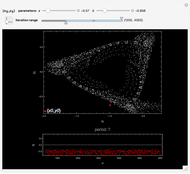 Iterations of Strick Map
Erik Mahieu Orbits of Martin's Map
Erik Mahieu Orbits of the Hopalong Map
Erik Mahieu Bifurcation Diagram of the Hénon Map
Erik Mahieu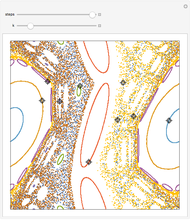 The Sawtooth Standard Map
Enrique Zeleny Iterates of Generalized Logistic Maps for Superstable Parameter Values
Ki-Jung Moon Classic Logistic Map
Robert M Lurie
-
 4. Ambiguous Rings Based on a Heart Curve
Erik Mahieu -
 3. Ambiguous Rings Based on a Rose Curve
Erik Mahieu -
 2. Ambiguous Rings Based on a Polygon
Erik Mahieu -
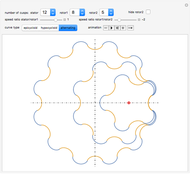
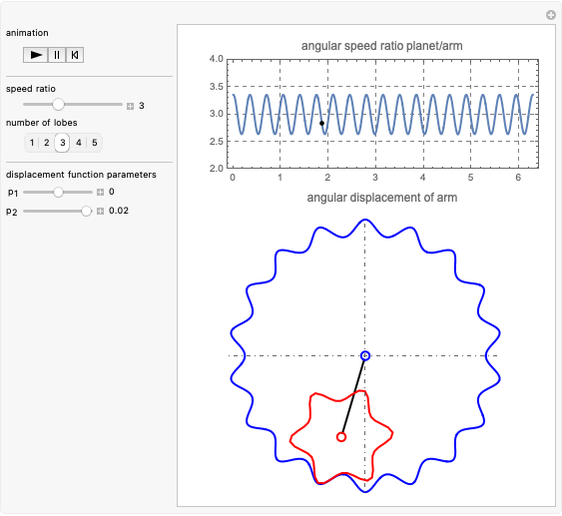 Noncircular Planetary Drive
Erik Mahieu -
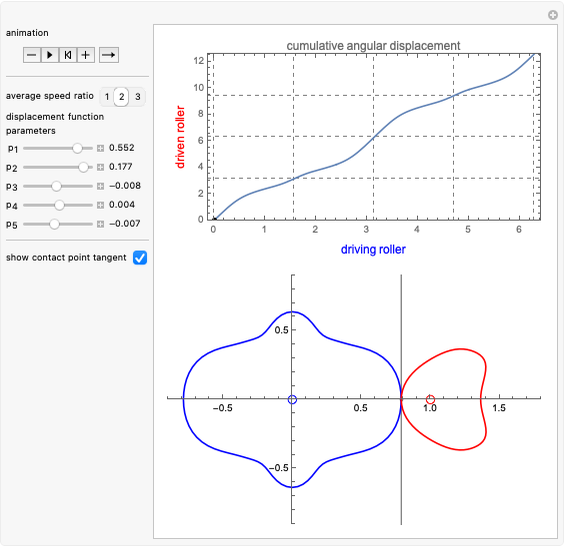 Noncircular Roller Drive
Erik Mahieu -
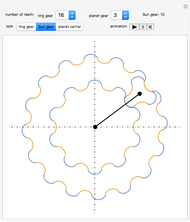 Planetary Gear Train
Erik Mahieu -
 Rolling Cycloidal Curves
Erik Mahieu -
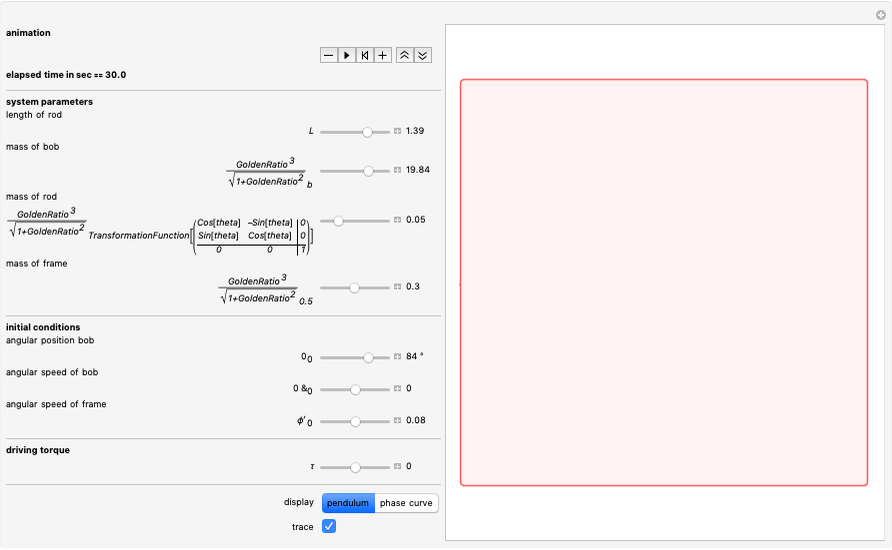 Driven Spherical Pendulum
Erik Mahieu -
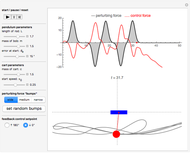 Automatic Feedback Control of a Pendulum-and-Cart System
Erik Mahieu -
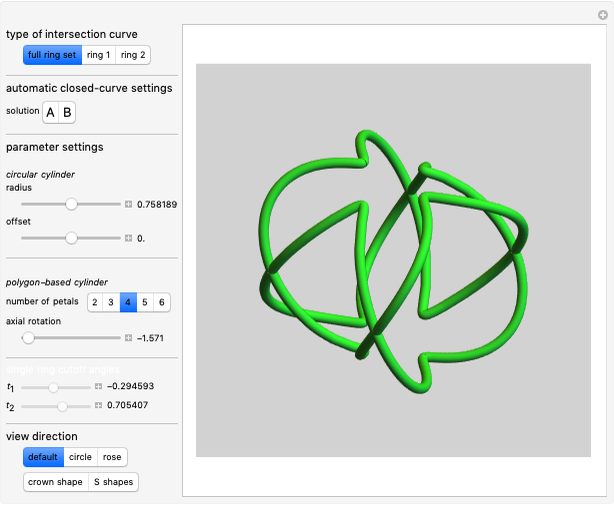
 Intersection of a Generalized Cylinder over a Rose Curve with a Circular Cylinder
Erik Mahieu -
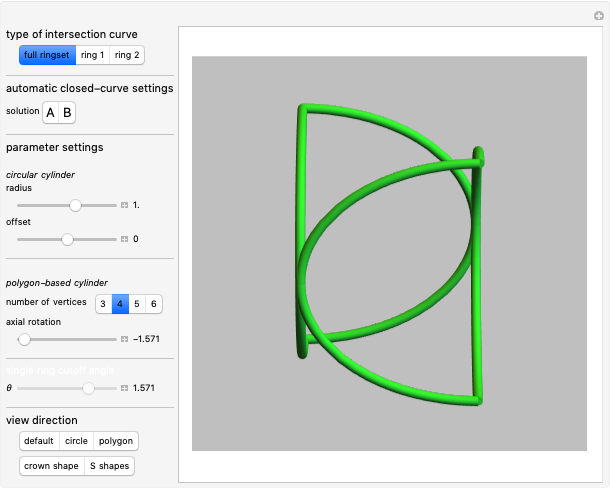
 1. Ambiguous Rings
Erik Mahieu -
 Elliptic Epitrochoid
Erik Mahieu -
 Intersection of Two Polygonal Cylinders
Erik Mahieu -
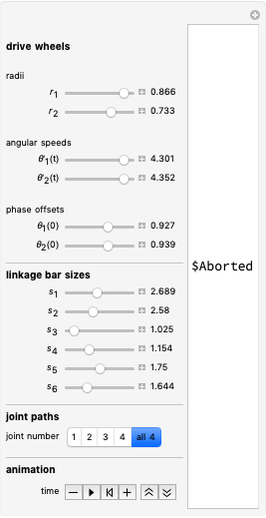 Designs from Mechanical Linkages
Erik Mahieu -
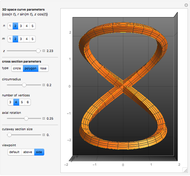 3D Extrusion Using the Frenet-Serret System
Erik Mahieu -
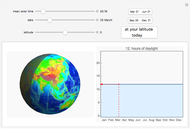 Daylight Calculator
Erik Mahieu -
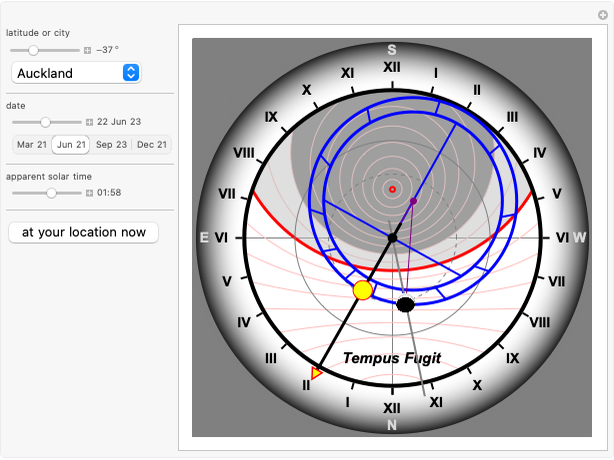 Astronomical Clock
Erik Mahieu -
 Cylindrical Anamorphosis of 3D Polygonal Meshes
Erik Mahieu -
 Cylindrical Anamorphosis of Parametric Surfaces
Erik Mahieu -
 Roulette (Hypotrochogon) of a Polygon Rolling inside a Circle
Erik Mahieu