Classic Logistic Map


Requires a Wolfram Notebook System
Interact on desktop, mobile and cloud with the free Wolfram Player or other Wolfram Language products.
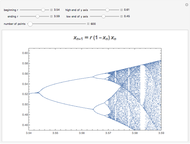
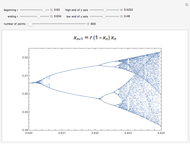
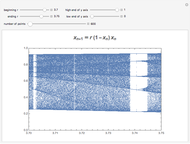
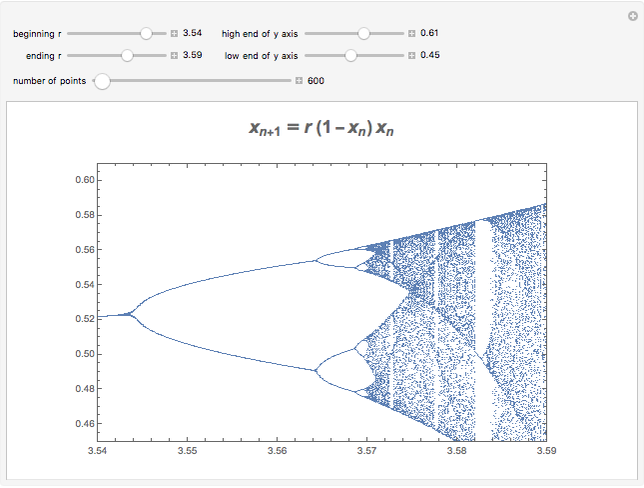
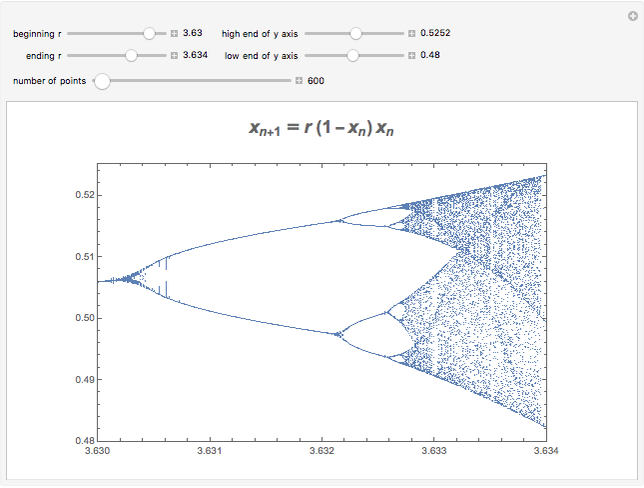
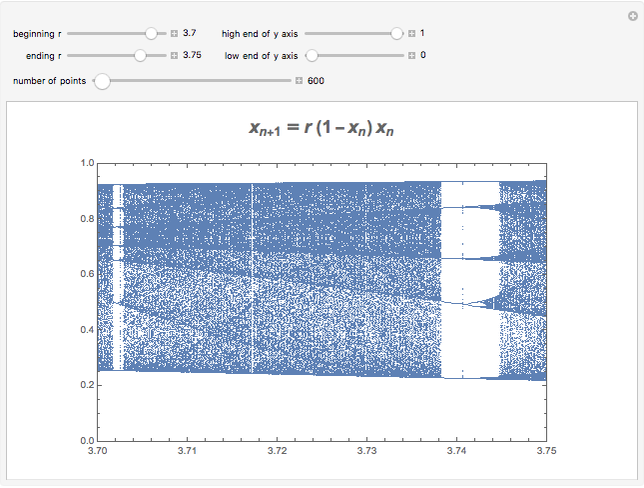
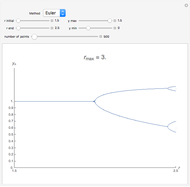
The classic logistic map is widely used to show the properties of chaotic dynamics. This version lets you explore and enlarge different areas of the map to show its fractal nature. As the magnification increases, it is helpful to increase the number of points that are plotted.
Contributed by: Robert M Lurie (March 2011)
Based on programs by: Heikki Ruskeepää
Open content licensed under CC BY-NC-SA
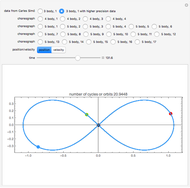
Snapshots
Details
The classic logistic map is widely used to illustrate chaos and bifurcation. This is especially useful in demonstrating and teaching chaos. The snapshots show the similarity in appearance of the map as you zoom in on the areas of bifurcation, sometimes known as scale invariance.
This formulation is modified from that given in the book by H. Ruskeepää, Mathematica Navigator, 3rd ed., San Diego, CA: Academic Press, 2009 p. 941 ff. This book is highly recommended for users of Mathematica 6 or 7.
A major reference is R. M. May, "Simple Mathematical Models with Very Complicated Dynamics," Nature, 261, 1976 pp. 459–467. Another widely used reference is J. Gleick, Chaos: Making a New Science, London: Viking Penguin, 1987 and 2008.
Permanent Citation
"Classic Logistic Map"
http://demonstrations.wolfram.com/ClassicLogisticMap/
Wolfram Demonstrations Project
Published: March 7 2011
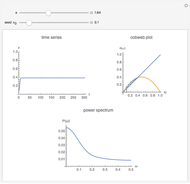 Three Views of the Logistic Map
Hiroki Sayama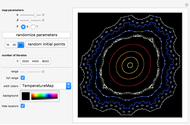 Orbits of the Hopalong Map
Erik Mahieu Orbits of Martin's Map
Erik Mahieu Variations of the Gingerbreadman Map
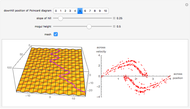
Erik Mahieu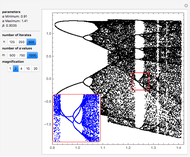 Bifurcation Diagram of the Hénon Map
Erik Mahieu Martin's Map Artwork
Erik Mahieu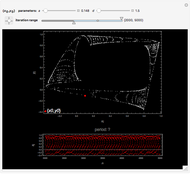 Iterations of Kaneko Map
Erik Mahieu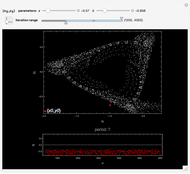 Iterations of Strick Map
Erik Mahieu Plotting Julia Sets
Owen Barrett Step-by-Step Julia Sets
Enrique Zeleny
-
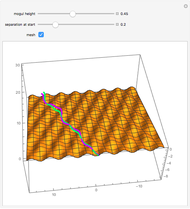 Chaos While Sledding on a Bumpy Slope
Robert M Lurie -
 Numerical Integration of the Logistic Equation Using Runge-Kutta Methods
Robert M Lurie -
 Sledding on a Bumpy Slope: Chaos and Strange Attractor
Robert M Lurie -
 Classic Logistic Map
Robert M Lurie -
 Restricted Three-Body Problem
Robert M Lurie -
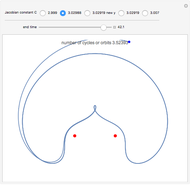
 Choreographic Motions of N Bodies
Robert M Lurie