Illustrating the Law of Large Numbers


Requires a Wolfram Notebook System
Interact on desktop, mobile and cloud with the free Wolfram Player or other Wolfram Language products.
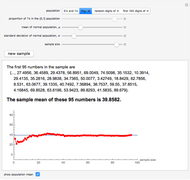
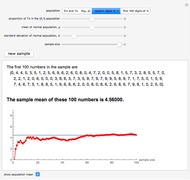
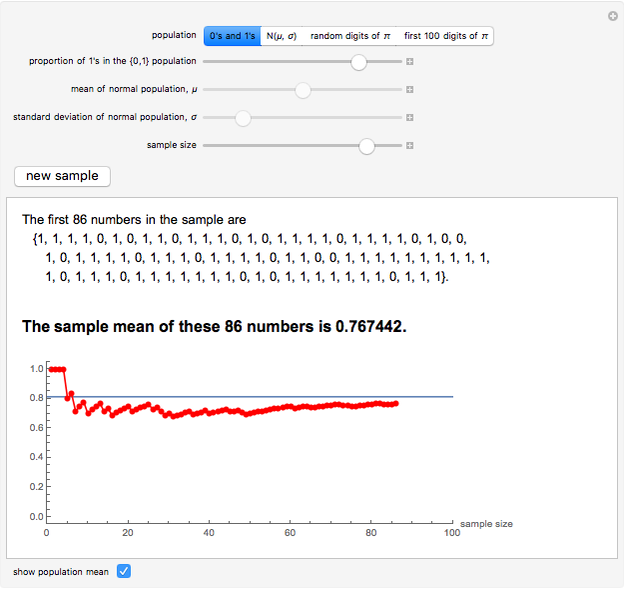
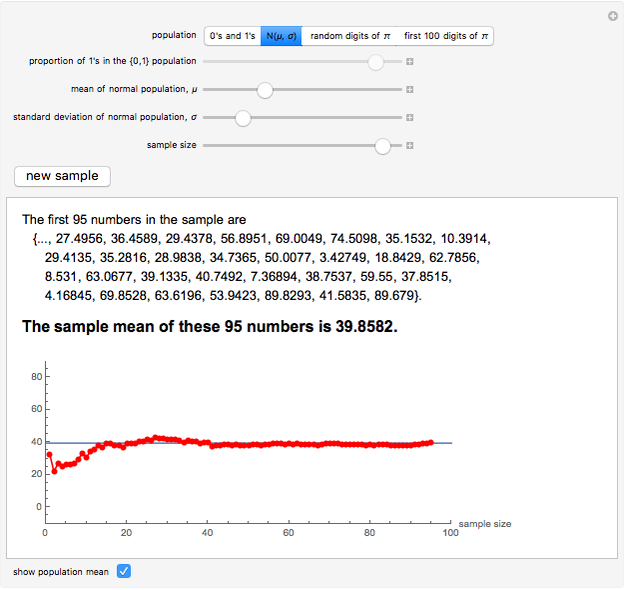
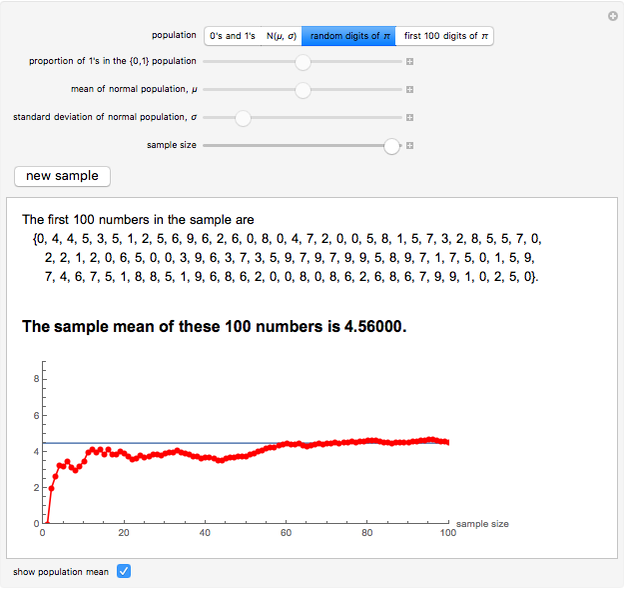
The law of large numbers states (informally) that as the number of independent observations drawn from a population with finite mean  increases, the mean of those observed values approaches . This Demonstration illustrates that behavior by plotting the sample mean as a function of the current sample size
  , for
, for  to
to  . Random samples can be drawn from a population of 0's and 1's (with any proportion of 1's), a normal population (with a range of and
  available), or from the (first 100,000) digits of
  . The first 100 digits of are available as a population, with samples of size consisting of the first digits, to allow for classroom illustration with a familiar and frequently referred to as random set of digits.
Contributed by: Marc Brodie (Wheeling Jesuit University) (March 2011)
Open content licensed under CC BY-NC-SA
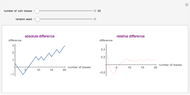
Snapshots

Details
Permanent Citation
 Law of Large Numbers: Comparing Relative versus Absolute Frequency of Coin Flips
Paul Savory (University of Nebraska-Lincoln)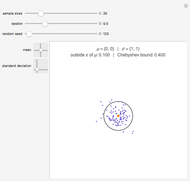 Chebyshev's Inequality and the Weak Law of Large Numbers for iid Two-Vectors
Jeff Bryant and Chris Boucher The Law of the Iterated Logarithm in Probability Theory
Tomas Garza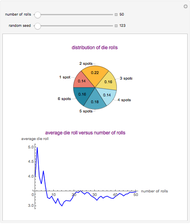 Law of Large Numbers: Dice Rolling Example
Paul Savory (University of Nebraska-Lincoln)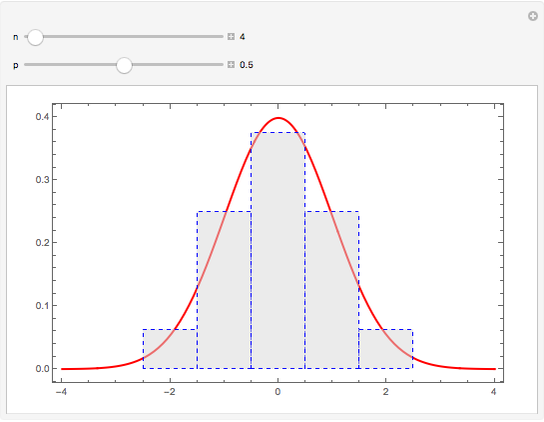 Illustrating the Central Limit Theorem with Sums of Bernoulli Random Variables
Ian McLeod (University of Western Ontario)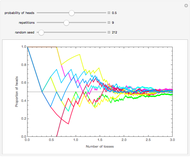 Simulated Coin Tossing Experiments and the Law of Large Numbers
Ian McLeod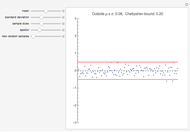 Chebyshev's Inequality and the Weak Law of Large Numbers
Chris Boucher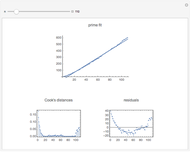 Fitting Primes to a Linear Model
Darren Glosemeyer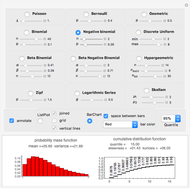 Illustrating the Use of Discrete Distributions
Nasser M. Abbasi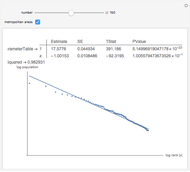 Zipf's Law for U.S. Cities
Fiona Maclachlan
-
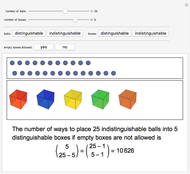 Arranging Balls into Boxes
Marc Brodie -
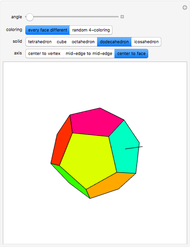 Rotational Symmetries of Colored Platonic Solids
Marc Brodie -
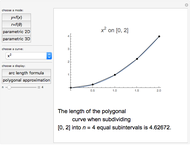 Arc Length and Polygonal Approximations
Marc Brodie -
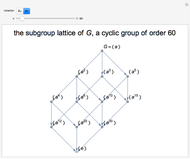 Subgroup Lattices of Finite Cyclic Groups
Marc Brodie -
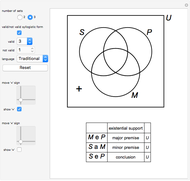 Venn Diagrams and Syllogisms
Marc Brodie -
 Crossword Grid Maker
Marc Brodie -
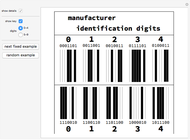 UPC Bar Code
Marc Brodie -
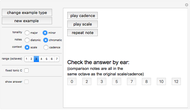 Recognizing Notes in the Context of a Key
Marc Brodie -
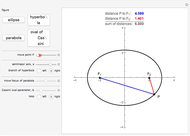 Locus of Points Definition of an Ellipse, Hyperbola, Parabola, and Oval of Cassini
Marc Brodie -
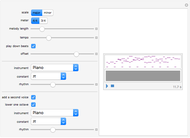 The Music of Mathematical Constants
Marc Brodie -
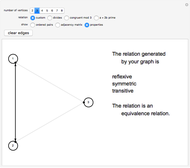 Exploring Relations on Sets
Marc Brodie -
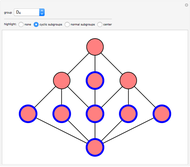 Subgroup Lattices of Groups of Small Order
Marc Brodie -
 Math Trivia Game
Marc Brodie -
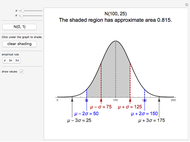 The Empirical Rule for Normal Distributions
Marc Brodie -
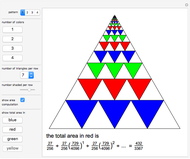 Geometric Series Based on Equilateral Triangles
Marc Brodie -
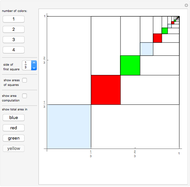 Geometric Series Based on the Areas of Squares
Marc Brodie -
 Bulls and Cows
Marc Brodie -
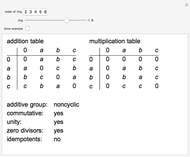 Rings of Small Order
Marc Brodie -
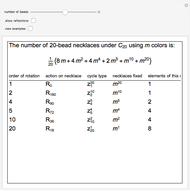 Counting Necklaces
Marc Brodie -
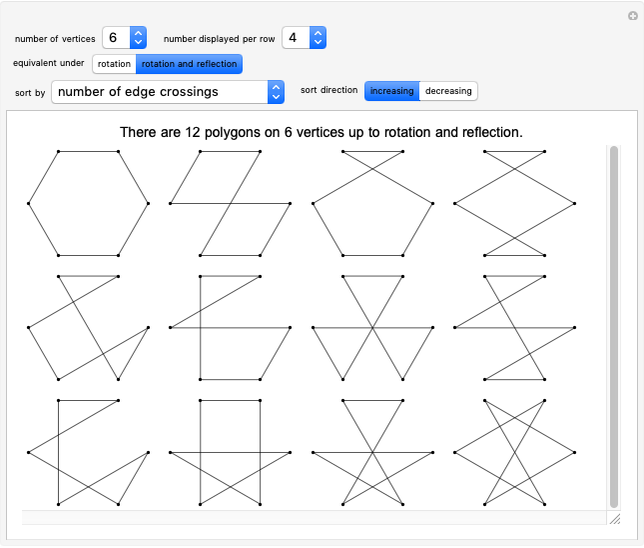 Polygons on n Vertices
Marc Brodie