Instantaneous Rate of Change: Exploring More Functions
Initializing live version


Requires a Wolfram Notebook System
Interact on desktop, mobile and cloud with the free Wolfram Player or other Wolfram Language products.
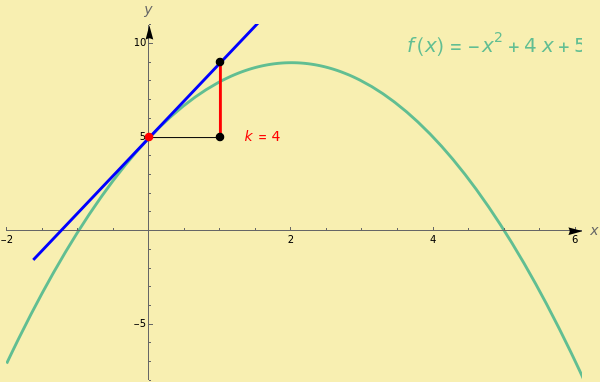
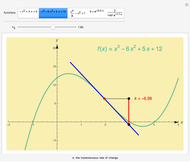
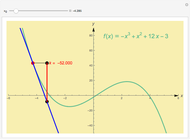
This Demonstration shows the instantaneous rate of change of  for different
  values for polynomial functions of degree 2, 3, and 4, an exponential function, and a logistic function.


Contributed by: Wolfgang Narrath and Reinhard Simonovits (March 2011)
Open content licensed under CC BY-NC-SA
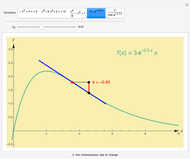
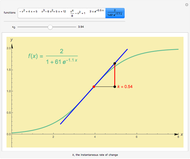
Snapshots


Details
Permanent Citation
Related Demonstrations
More by Author
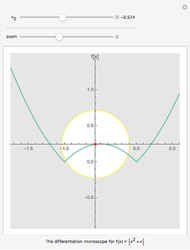 Differentiation Microscope
Wolfgang Narrath and Reinhard Simonovits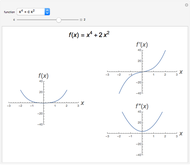 Changing a Coefficient in Polynomials of Low Degree
Angela Sharp, Chad Pierson, and Joshua Fritz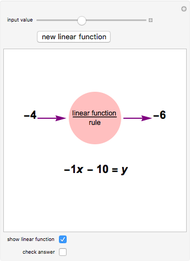 Finding the Linear Function Rule
Sarah Lichtblau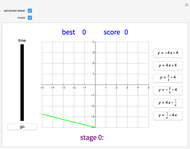 Equation of a Line Game
Sergio Hannibal Mejía (Yokohama International School)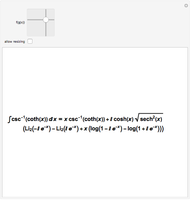 Integrals of Nested Elementary Functions
Michael Trott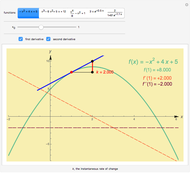 Instantaneous Rate of Change: Exploring More Functions with the First and Second Derivatives
Wolfgang Narrath and Reinhard Simonovits Area between a Line and the Graph of a Function
Abraham Gadalla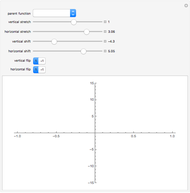 Transforming Parent Functions
Jim Wysocki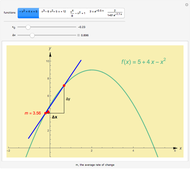 Average Rate of Change: Exploring More Functions
Wolfgang Narrath and Reinhard Simonovits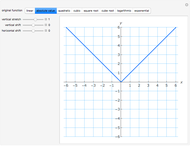 A Library of Functions with Transformations
Ed Zaborowski
-
Instantaneous Rate of Change: Exploring More Functions with the First and Second Derivatives
Reinhard Simonovits -
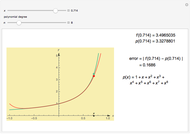 Quality of Approximation by Geometric Series
Reinhard Simonovits -
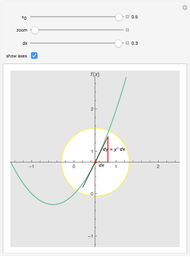 Differential of a Function
Reinhard Simonovits -
Average Rate of Change: Exploring More Functions
Reinhard Simonovits -
 Instantaneous Rate of Change: Exploring More Functions
Reinhard Simonovits -
Differentiation Microscope
Reinhard Simonovits -
 Instantaneous Rate of Change
Reinhard Simonovits