Negligible Senescence Scenario


Requires a Wolfram Notebook System
Interact on desktop, mobile and cloud with the free Wolfram Player or other Wolfram Language products.
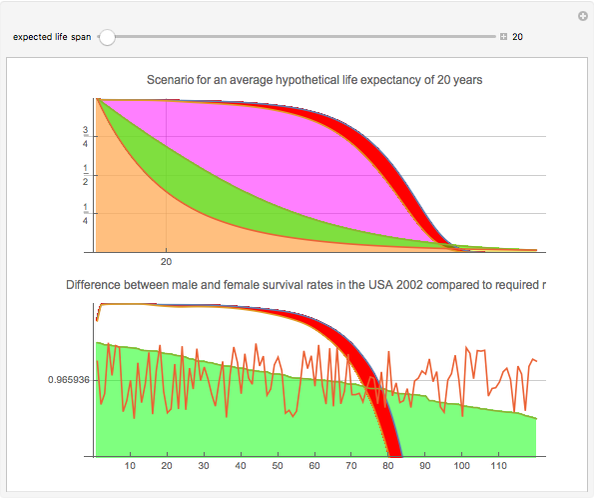
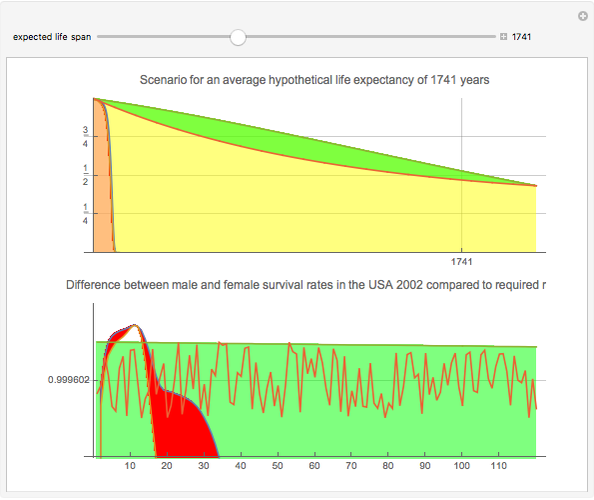
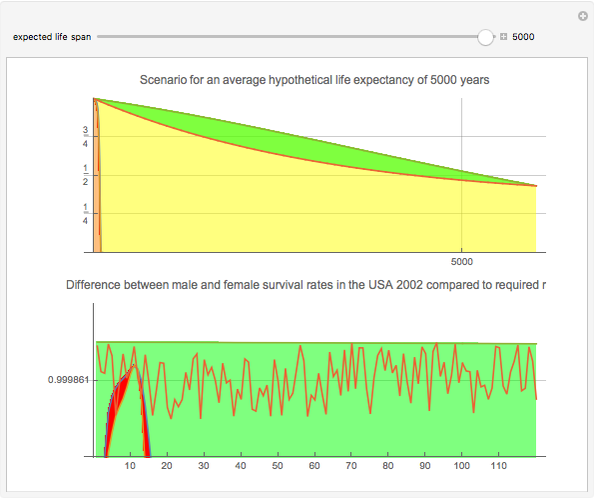
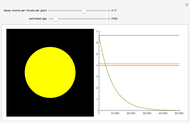
The controversial age research visionary Aubrey de Gray claims that average life expectancy can be increased rapidly to about 5000 years. The upper graph shows percentages of people alive at different ages. The lower graph represents survivor rates at different ages.
[more]
Contributed by: Michael Schreiber (March 2011)
Open content licensed under CC BY-NC-SA
Snapshots


Details
The underlying data comes from the U.S. 2002 standard life table. For more information see: Aubrey de Gray.
Permanent Citation
"Negligible Senescence Scenario"
http://demonstrations.wolfram.com/NegligibleSenescenceScenario/
Wolfram Demonstrations Project
Published: March 7 2011
 Life Expectancy in the U.S. Population
Jean Buck and Mike Pilat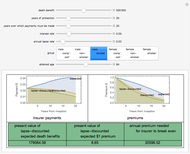 Life Insurance Pricing
Seth J. Chandler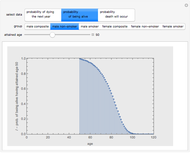 The 2001 CSO Mortality Tables
Seth J. Chandler Additive and Multiplicative Risks
Mark D. Normand and Micha Peleg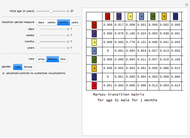 Life Transitions
Seth J. Chandler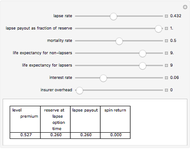 A Conceptual Model of Lapse Financed Life Insurance
Seth J. Chandler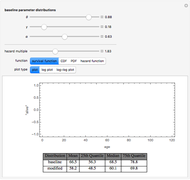 Multiplication of Hazard in Expo-Power Distributions
Seth J. Chandler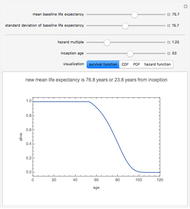 Multiplication of Hazard in Gompertz-Makeham Distributions
Seth J. Chandler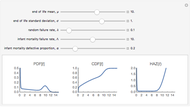 Closed-Form Full Life Cycle Distribution
Kelly S. Lowder Acceptance/Rejection Sampling
Ryan Carroll and Jeff Hamrick
-
 Ten Year Calendar
Michael Schreiber -
 Spanning Tree of Points on Sphere
Michael Schreiber -
 Simple Three-Letter Cube
Michael Schreiber -
 Arithmetic Sculpture for Addition and Multiplication
Michael Schreiber -
 Carbon Dating
Michael Schreiber -
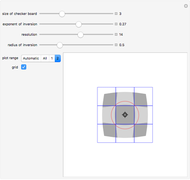 Board Inversion
Michael Schreiber -
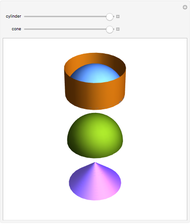 Cylinder Hemisphere Cone
Michael Schreiber -
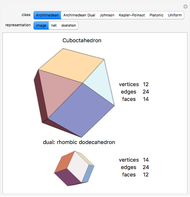 Polyhedron Dual
Michael Schreiber -
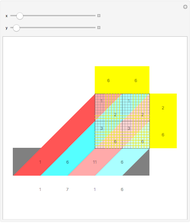 Lattice Multiplication
Michael Schreiber -
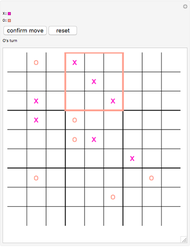 Ultimate Tic-Tac-Toe
Michael Schreiber -
 Keccak Cinema Contemplation
Michael Schreiber -
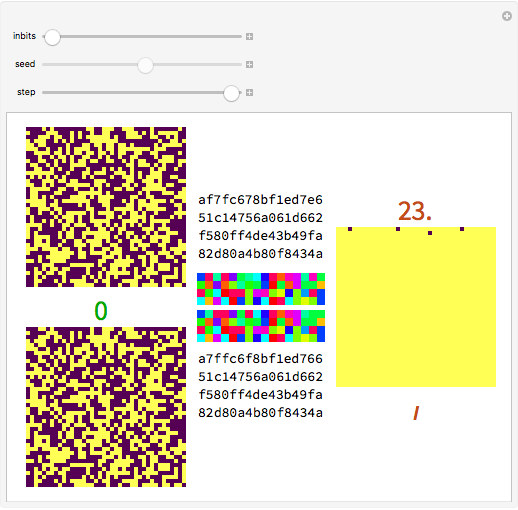 Xored Keccak States for Steps in Rounds of SHA-3
Michael Schreiber -
 Spirals of Squares
Michael Schreiber -
 Opposite Rotations of Frame Segments
Michael Schreiber -
 Intersecting Circles
Michael Schreiber -
 Abacus
Michael Schreiber -
 Doubling a Distance with a Compass
Michael Schreiber -
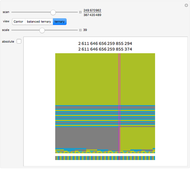 The Cantor Sequence with Bits
Michael Schreiber -
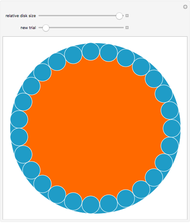 Diffusion-Limited Clogging
Michael Schreiber -
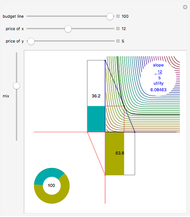 Marginal Utility Budget Line
Michael Schreiber