The 2001 CSO Mortality Tables


Requires a Wolfram Notebook System
Interact on desktop, mobile and cloud with the free Wolfram Player or other Wolfram Language products.
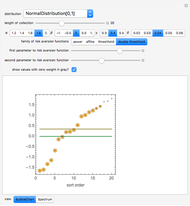
The 2001 CSO Mortality Tables represent the most widely used approximations as to the expected rates of death in the United States as a function of age. This Demonstration manipulates that data to produce three types of plots. The first type shows  , the probability that someone alive at the
  axis age
  will die the following year. The second type shows
  , the probability that someone alive at a user-specified "attained age" will be alive at the axis age. The third type shows
  , the probability that someone alive at a user-specified attained age will die during the axis age.
Contributed by: Seth J. Chandler (March 2011)
Open content licensed under CC BY-NC-SA
Snapshots


Details
The data used in this Demonstration was taken from data developed by the American Academy of Actuaries CSO Task Force from the Valuation Basic Mortality Table developed by the Society of Actuaries Individual Life Insurance Valuation Mortality Task Force, and was adopted by the National Association of Insurance Commissioners (NAIC) in December 2002. As of May 2007, it may be found online at http://www.actuary.org/life/cso/appendix_a_jun02.xls.
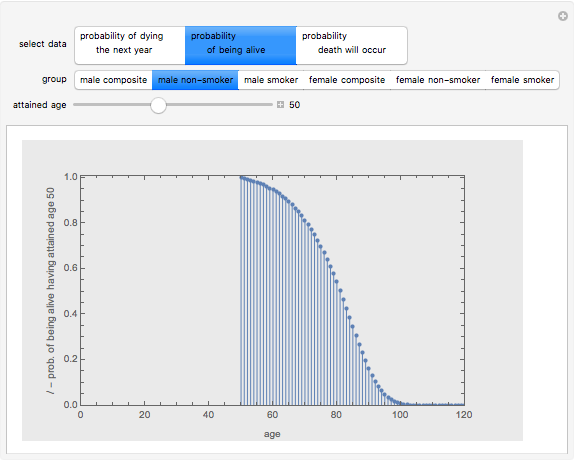
Snapshot 1: the probability a 50 year old male non-smoker will be alive at various ages
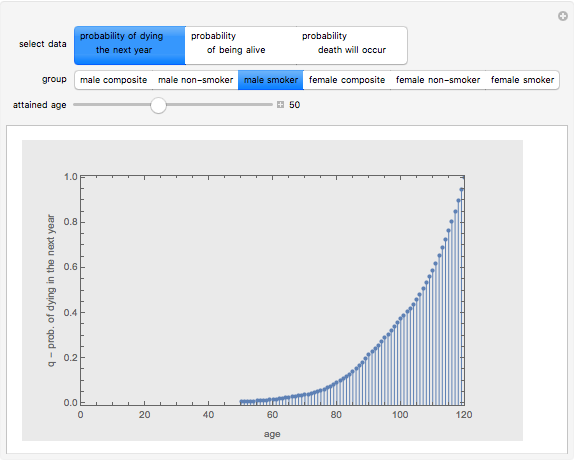
Snapshot 2: the probability a male smoker alive at a given time will die the next year (starting at age 50)
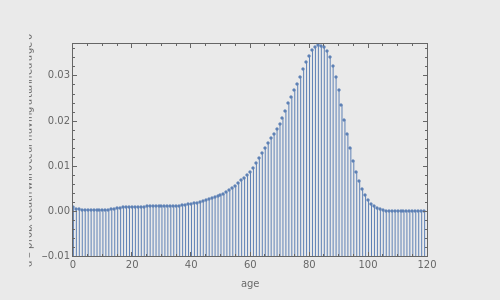
Snapshot 3: the probability that a 22 year old female non-smoker will die during the axis age
Permanent Citation
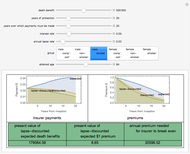 Life Insurance Pricing
Seth J. Chandler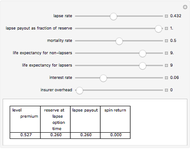 A Conceptual Model of Lapse Financed Life Insurance
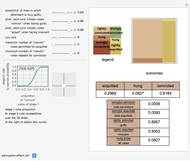
Seth J. Chandler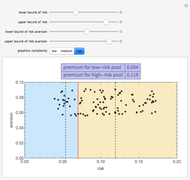 Adverse Selection
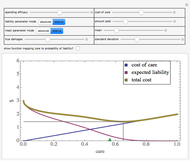
Seth J. Chandler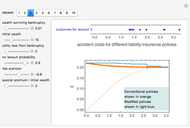 Efficient Single Limit Liability Insurance
Seth J. Chandler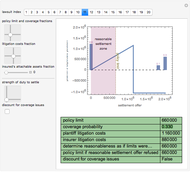 The Duty to Settle
Seth J. Chandler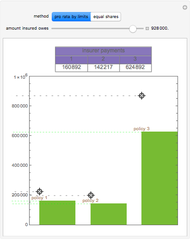 Coordination of Insurance Policies
Seth J. Chandler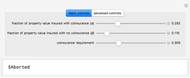 Property Coinsurance
Seth J. Chandler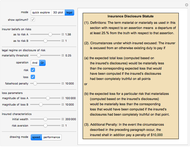 Insurance Disclosures
Seth J. Chandler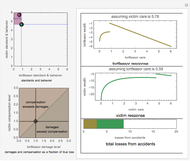 Bilateral Accident Model
Seth J. Chandler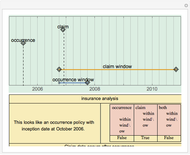 Occurrence versus Claims-Made Insurance Policies
Seth J. Chandler
-
 Post-Event Bonding
Seth J. Chandler -
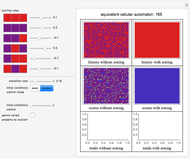 Emulating Land Use Evolution with a Cellular Automaton
Seth J. Chandler -
 General Assembly Resolution Viewer
Seth J. Chandler -
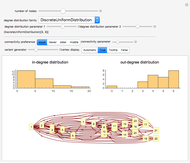 Random Acyclic Networks
Seth J. Chandler -
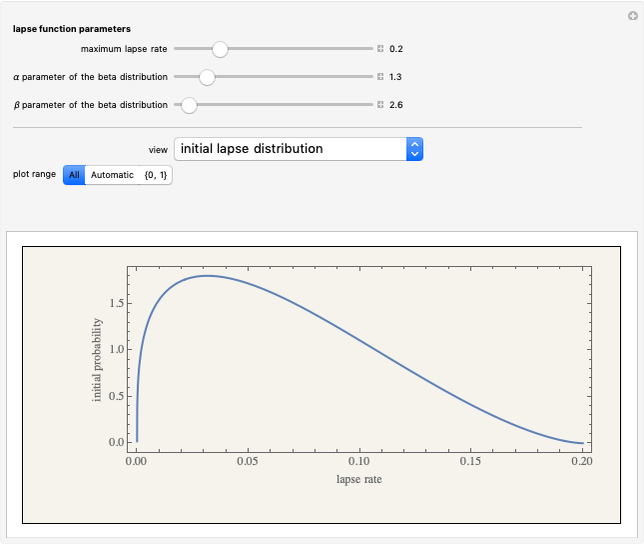 A Theory of Insurance Lapses
Seth J. Chandler -
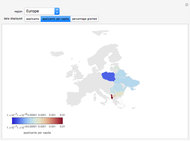 Asylum in the United States
Seth J. Chandler -
Property Coinsurance
Seth J. Chandler -
 The Persuasion Effect: A Traditional Two-Stage Jury Model
Seth J. Chandler -
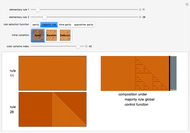 Cellular Automata with Global Control
Seth J. Chandler -
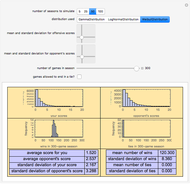 Sports Seasons Based on Score Distributions
Seth J. Chandler -
 Evidentiary Uncertainty
Seth J. Chandler -
 Spectral Measures
Seth J. Chandler -
 The Banzhaf Power Index of States for Presidential Candidates
Seth J. Chandler -
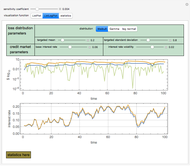
 Liability Insurance Desirability under Lognormal Loss Distributions
Seth J. Chandler -
 The Effects of Coinsurance and Deductibles on Optimal Precautions for Weibull-Distributed Loss
Seth J. Chandler -
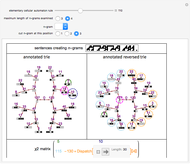 Collocation by Chi Square
Seth J. Chandler -
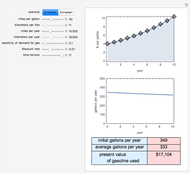 The Present Value of Future Gas Use
Seth J. Chandler -
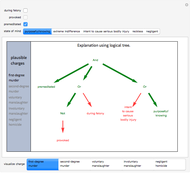 Visualizing Legal Rules: A Homicide Case
Seth J. Chandler -
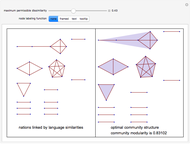 Communities of Nations Bridged by Language Similarity
Seth J. Chandler