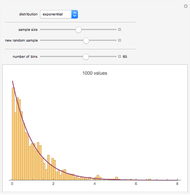
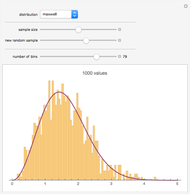
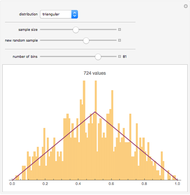
Sample versus Theoretical Distribution
Initializing live version


Requires a Wolfram Notebook System
Interact on desktop, mobile and cloud with the free Wolfram Player or other Wolfram Language products.
You often have to collect many values before a sample distribution begins to resemble the theoretical curve.
Contributed by: Joe Bolte (March 2011)
Open content licensed under CC BY-NC-SA
Snapshots


Details
detailSectionParagraphPermanent Citation
"Sample versus Theoretical Distribution"
http://demonstrations.wolfram.com/SampleVersusTheoreticalDistribution/
Wolfram Demonstrations Project
Published: March 7 2011
Related Demonstrations
More by Author
 Robustness of Student t in the One-Sample Problem
Ian McLeod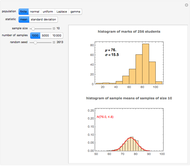 Sampling Distribution of the Mean and Standard Deviation in Various Populations
Ian McLeod Reliability Distributions
Joe O'Hara Interpolating a Set of Data
Stephen Wolfram Frequency Spectrum of a Noisy Signal
Jon McLoone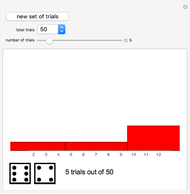 Two Dice with Histogram
Abby Brown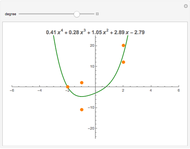 Fitting a Curve to Five Points
Rob Morris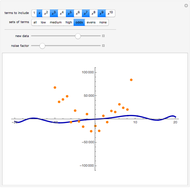 Fitting Noisy Data
Rob Morris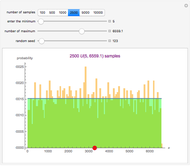 Impact of Sample Size on Approximating the Uniform Distribution
Paul Savory (University of Nebraska-Lincoln)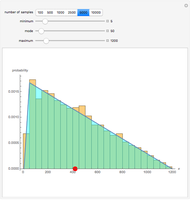 Impact of Sample Size on Approximating the Triangular Distribution
Paul Savory (University of Nebraska-Lincoln)
-
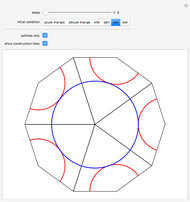 Penrose Tiles
Joe Bolte -
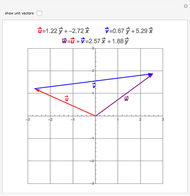 2D Vector Addition
Joe Bolte -
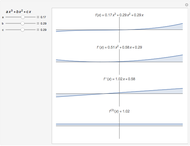 Successive Derivatives of a Polynomial
Joe Bolte -
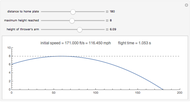
 Shooting a Ball from a Block Sliding Down a Ramp
Joe Bolte -
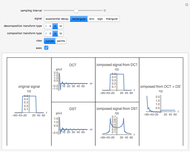 Discrete Fourier Sine and Cosine Transforms
Joe Bolte -
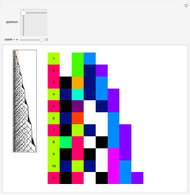 Prime-Generating Cellular Automaton
Joe Bolte -
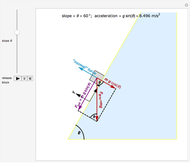 Block on a Frictionless Inclined Plane
Joe Bolte -
 Sample versus Theoretical Distribution
Joe Bolte -
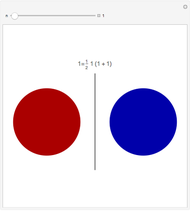
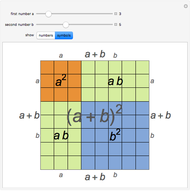 Square of the Sum of Two Numbers
Joe Bolte -
 Throwing a Baseball from the Outfield to Home Plate
Joe Bolte -
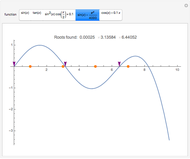 Root Finder
Joe Bolte -
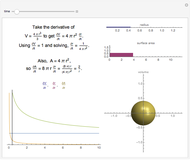 Relation of Radius, Surface Area, and Volume of a Sphere
Joe Bolte -
 Sums of Consecutive Integers
Joe Bolte -
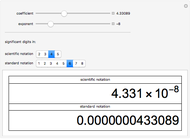 Scientific Notation
Joe Bolte -
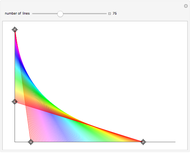 Rainbow String Figures
Joe Bolte -
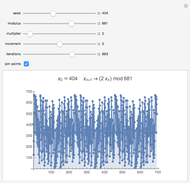 Linear Congruential Generators
Joe Bolte