Robustness of Student t in the One-Sample Problem


Requires a Wolfram Notebook System
Interact on desktop, mobile and cloud with the free Wolfram Player or other Wolfram Language products.
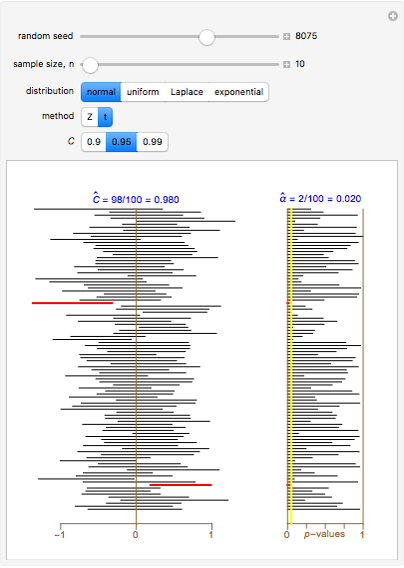
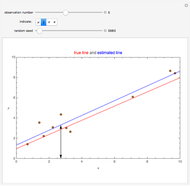
Level  confidence intervals and
  -values are shown for 100 simple random samples of size
  drawn from the specified population with mean
  and standard deviation
  . The
. The  and
and  methods are compared for calculating the confidence intervals and -values. The method is based on the normal distribution using the estimated standard deviation in place of the unknown
  . The method is approximately valid for large enough for all distributions considered in this Demonstration. The method uses the Student -distribution with
  degrees of freedom; it is exact in the case of the normal distribution and is approximate for the other distributions considered in this Demonstration.


Contributed by: Ian McLeod (March 2011)
Open content licensed under CC BY-NC-SA
Snapshots


Details
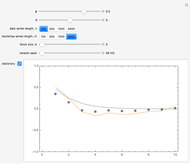
Each of the distributions used has population mean 0 and variance 1, as indicated on the scale at the bottom of the left panel. The -value is for testing  versus
  . Of the three non-normal distributions considered, the methods work almost as well for the uniform and Laplace distributions as the normal for sample sizes as small as 10, but for such small samples the exponential distribution generates intervals and -tests that are not conservative. As increases, there is an improvement.
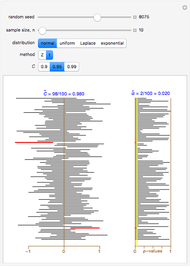
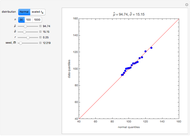
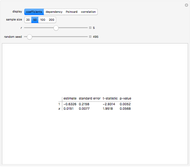
Snapshot 1: setting  and using the -test method with the normal distribution and
  , we find after some simulations that the empirical values for the estimates
  and
and  are close to their theoretical values of 0.95 and 0.05
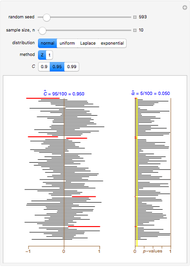
Snapshot 2: as in Snapshot 1, but using the -test instead of the -test; after a large number of simulations, we see the empirical coverage probability is about 92%, which means the confidence intervals are too narrow; similarly the type I error at 8% is well above its nominal 5% value; this demonstrates that the -test method is not conservative in small samples
Snapshot 3: as in Snapshot 1, but with the uniform distribution; no observable difference from the normal population case
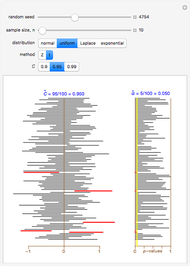
Snapshot 4: as in Snapshot 1, but with the Laplace distribution; this distribution has thicker tails than the normal, but even here the empirical coverage is not significantly different from the nominal 95% level, illustrating the robustness of the -distribution method
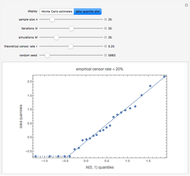
Snapshot 5: as in Snapshot 1, but with the exponential distribution; this distribution is right-skewed and very non-normal and in this case the method yields an empirical coverage rate of about  % instead of the nominal 95% value; the method is not even conservative in this case
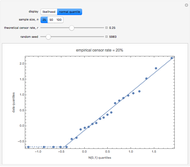
Snapshot 6: as in Snapshot 5, but the sample size is increased to  ; the methods have improved and only slightly overstate the statistical significance of the test
Snapshot 7: as in Snapshot 6, but the sample size is increased to  ; now the approximation is accurate
Permanent Citation
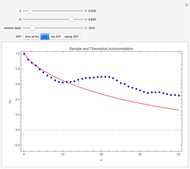
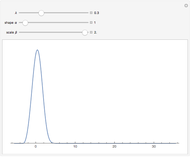
 Sample versus Theoretical Distribution
Joe Bolte Sampling Distribution of the Mean and Standard Deviation in Various Populations
Ian McLeod Impact of Sample Size on Approximating the Uniform Distribution
Paul Savory (University of Nebraska-Lincoln) The p-Value in One-Sample Tests for the Mean
Ian McLeod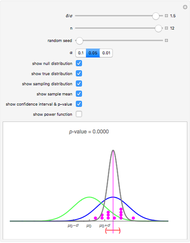 One-Sample t-Test and Confidence Interval with Dot Chart in Small Samples
Douglas Woolford and Ian McLeod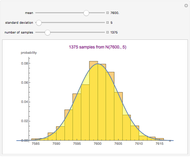 Impact of Sample Size on Approximating the Normal Distribution
Paul Savory (University of Nebraska-Lincoln)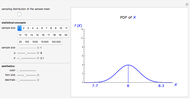 Sampling Distribution of the Sample Mean
Jim R Larkin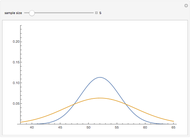 Distribution of Normal Means with Different Sample Sizes
David Gurney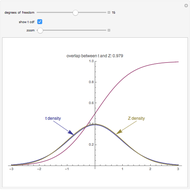 Student's t-Distribution
Chris Boucher Statistics Associated with Normal Samples
Pierre-Emmanuel Robert
-
 Rank Transform in Harmonic Regression Time Series
Ian McLeod -
 Detecting Periodicity in Short Time Series
Ian McLeod -
 Tempered Fractionally Differenced White Noise
Ian McLeod -
 Regression toward the Mean
Ian McLeod -
 Spread-Location Regression Diagnostic Check
Ian McLeod -
 Anscombe Quartet
Ian McLeod -
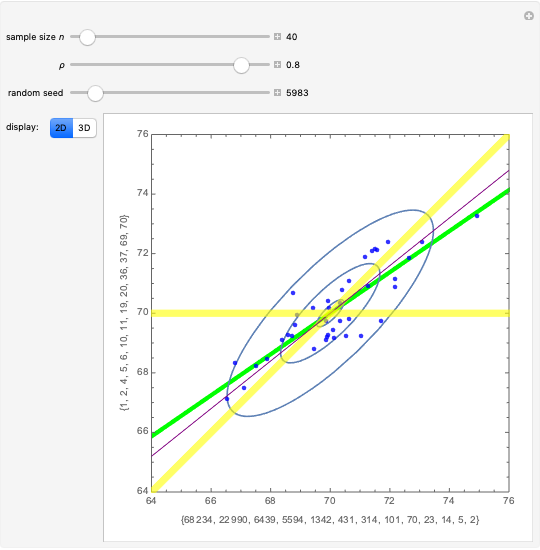
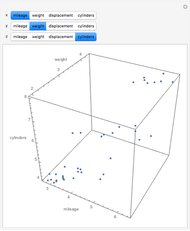 Visualizing Higher-Dimensional Data with 3D Scatterplots
Ian McLeod -
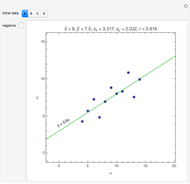
 Mean, Fitted-Value, Error, and Residual in Simple Linear Regression
Ian McLeod -
 Estimating and Diagnostic Checking in Censored Normal Random Samples
Ian McLeod -
 Comparing Gamma and Log-Normal Distributions
Ian McLeod -
 Monte Carlo Expectation-Maximization (EM) Algorithm
Ian McLeod -
 Comparing Exact and Approximate Censored Normal Likelihoods
Ian McLeod -
 Transformation to Symmetry of Gamma Random Variables
Ian McLeod -
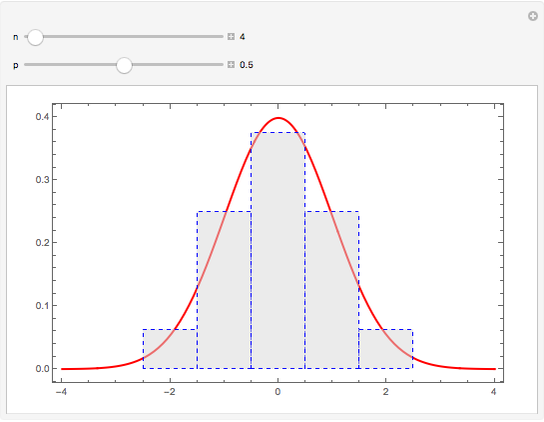 Illustrating the Central Limit Theorem with Sums of Bernoulli Random Variables
Ian McLeod -
 Hidden Correlation in Regression
Ian McLeod -
 Informal Power Assessment of the Normal Probability Plot
Ian McLeod -
 Time Series for Power-Law Decay
Ian McLeod -
 Block Bootstrap for Time Series
Ian McLeod -
 Fractional Gaussian Noise
Ian McLeod -
 Plotting a Long Time Series
Ian McLeod