Spacetime Diagram


Requires a Wolfram Notebook System
Interact on desktop, mobile and cloud with the free Wolfram Player or other Wolfram Language products.
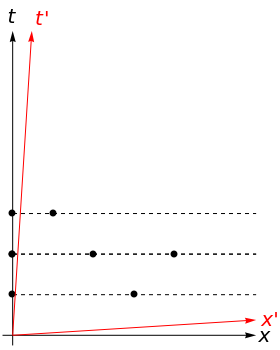
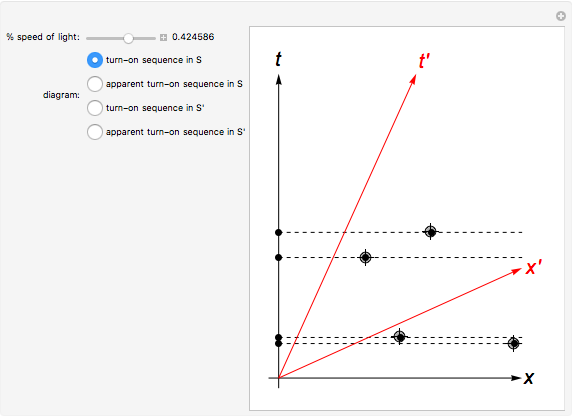
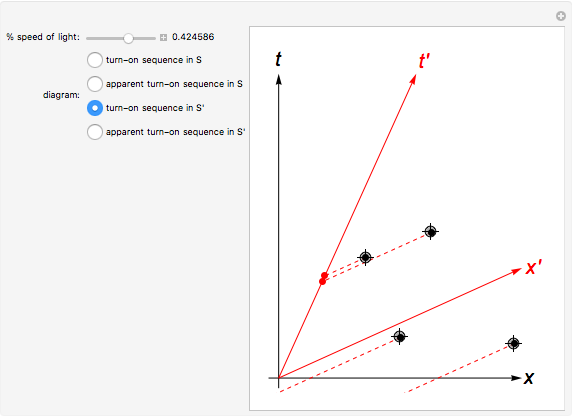
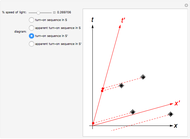
A spacetime diagram (or Minkowski diagram) is a combination of two coordinate systems: one in which an observer is at rest relative to certain events, and another for an observer in relative motion to the first. In such a diagram, light rays always follow paths with a 45° slope. The time of an event is indicated by its intersection with the appropriate time axis.
Contributed by: Kenny F. Stephens II (March 2011)
Open content licensed under CC BY-NC-SA
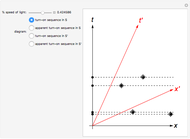
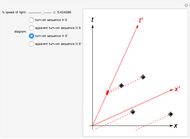
Snapshots

Details
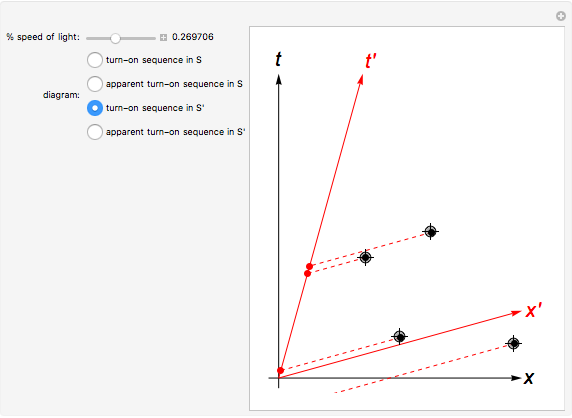
In the Demonstration, the observer at rest relative to the events is in the (black) unprimed coordinates while the observer in relative motion is in the (red) primed coordinates. There are four events (indicated by the locator objects) that can be repositioned by the user. The dashed lines project the events onto the respective time axis. The intersection with the axis is indicated by a dot; the dashed lines and dots are drawn in the appropriate color for the current observer. Four different measurements are available through the radio buttons: the "turn-on" sequence is the actual order in which the events occur while the "apparent turn-on" sequence is the order in which the events occur according to the respective observer (primed or unprimed). The relative speed can be varied with the slider to illustrate how the sequence of events depends upon the observer's relative motion with respect to the events.
For more information on this topic, see the Minkowski diagram from Wikipedia.
Permanent Citation
"Spacetime Diagram"
http://demonstrations.wolfram.com/SpacetimeDiagram/
Wolfram Demonstrations Project
Published: March 7 2011
 Spacetime versus Spacespace
Jonathan Doolin Properties of Kerr Spacetime
Thomas Müller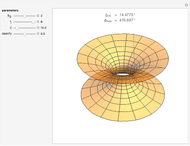 Geodesics in the Morris-Thorne Wormhole Spacetime
Thomas Müller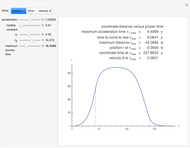 Uniform Acceleration within de Sitter Spacetime
Sebastian Boblest and Thomas Müller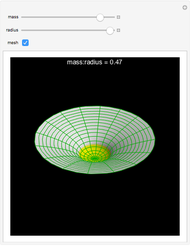 Schwarzschild Space-Time Embedding Diagram
Ben Langton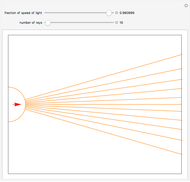 Relativistic Headlight Effect
Kenny F. Stephens II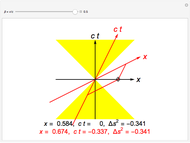 Minkowski Spacetime
S. M. Blinder Russell's Thought Experiment in Special Relativity
Enrique Zeleny The Headlight Effect
Paul A. Nakroshis (Department of Physics, University of Southern Maine, Portland, ME) Orbits around Schwarzschild Black Holes
David Saroff
-
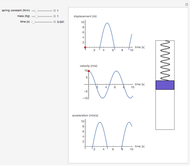 Mass on a Spring: Simple Harmonic Oscillator
Kenny F. Stephens II -
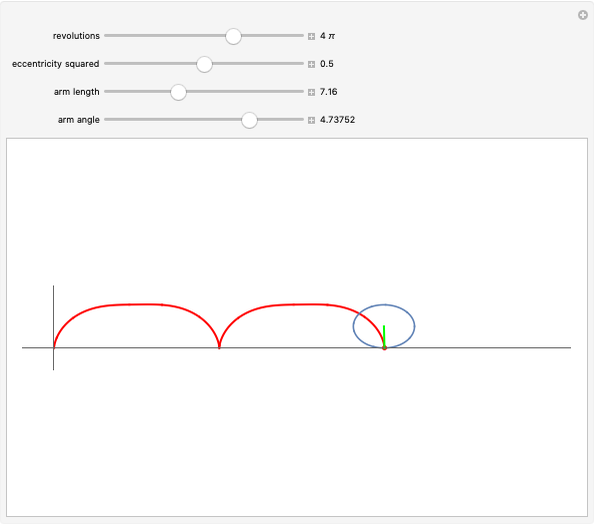 Cycloid from a Rolling Ellipse
Kenny F. Stephens II -
 Spacetime Diagram
Kenny F. Stephens II -
Relativistic Headlight Effect
Kenny F. Stephens II -
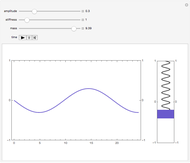 Simple Harmonic Motion of a Spring
Kenny F. Stephens II -
 Fourier Synthesis for Selected Waveforms
Kenny F. Stephens II