Two-State Protein Melting Curve (N, P, T Ensemble)


Requires a Wolfram Notebook System
Interact on desktop, mobile and cloud with the free Wolfram Player or other Wolfram Language products.
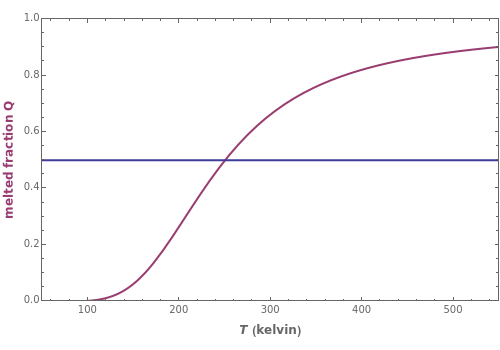
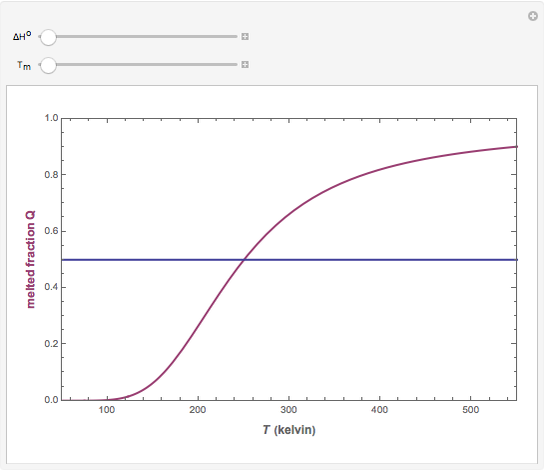
This Demonstration illustrates the fraction ( ) of a two‐state protein (or other biomolecule) that has melted at temperature
  . The two states of the protein are denoted
  (native or folded) and
  (denatured or melted) and we consider the dynamic equilibrium
  . The ratio of the two states' equilibrium concentrations is
  , where
  ) is the standard state Gibbs free energy difference and
  is the universal gas constant (8.314 J/mol-K). Melting occurs when
  (i.e.,
  ).
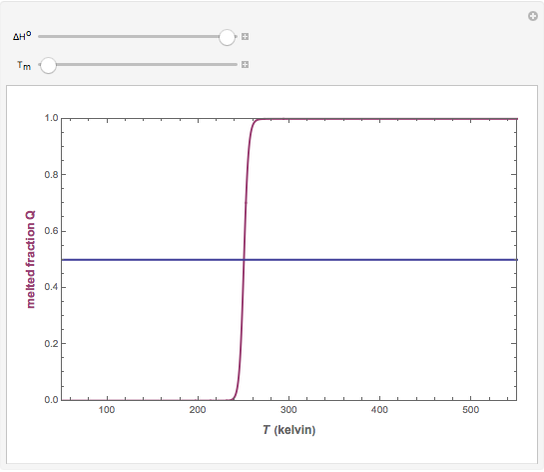
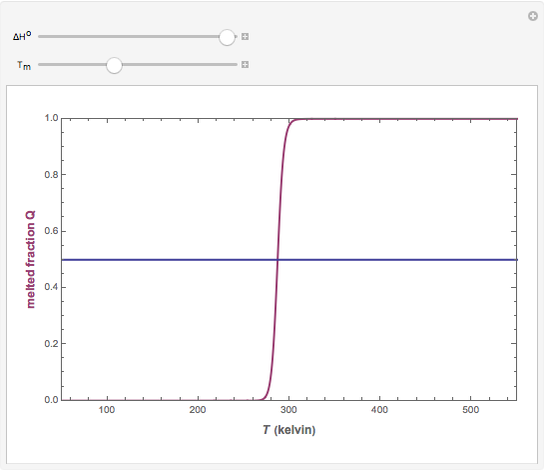
).  . The parameter
  (standard state enthalpy difference) controls the steepness of the transition, but does not affect the location of the point where
  . The temperature () at which
  is
is  and
and  .
.
Contributed by: David L. Pincus (March 2011)
Open content licensed under CC BY-NC-SA
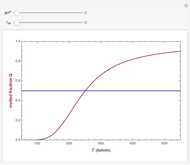
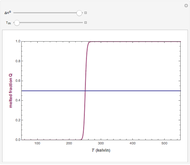
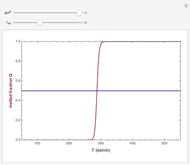
Snapshots
Details
Permanent Citation
 Solving the Cable Equation
Garrett Neske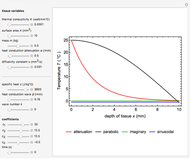 1D Heat Conduction through Biological Tissue
Muhamad Hamdi and Yusof Munajat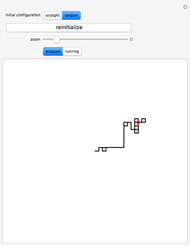 Pivoting Polymer
Paul-Jean Letourneau and Sungchul Ji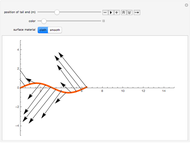 Model of Snake Locomotion by Frictional Forces
Christopher Umeki and Gregor Wettermann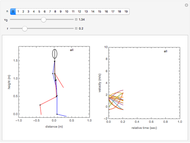 Micro-Doppler Sonar Simulation
Marshall Bradley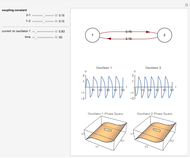 Desynchronization Dynamics of Two Coupled Oscillators
Garrett Neske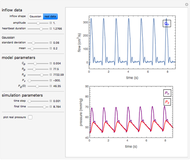 Windkessel Model for Hemodynamics in Arterial Systems
Mikel Landajuela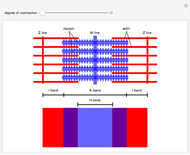 Sliding Filament Model of Muscle Contraction
Stephanie Hu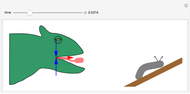 Mechanics of the Chameleon Tongue
Enrique Zeleny Minimal Hodgkin-Huxley Model: DC Stimulus
Qurat-ul-Ann (Anna) Mirza and Yogesh Joglekar

