Cumulative Sums and Visual Change Detection between Two Random Processes

Requires a Wolfram Notebook System
Interact on desktop, mobile and cloud with the free Wolfram Player or other Wolfram Language products.
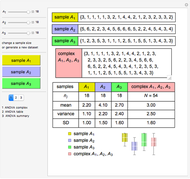
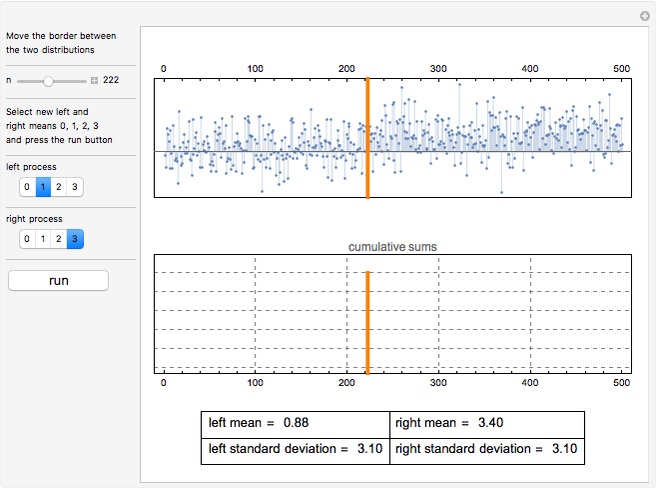
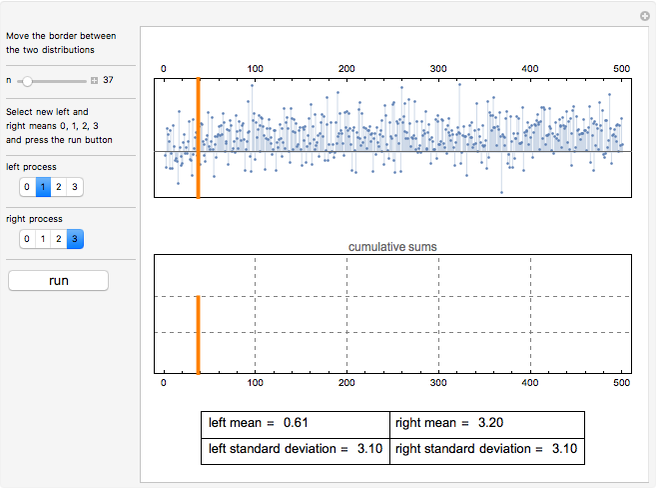
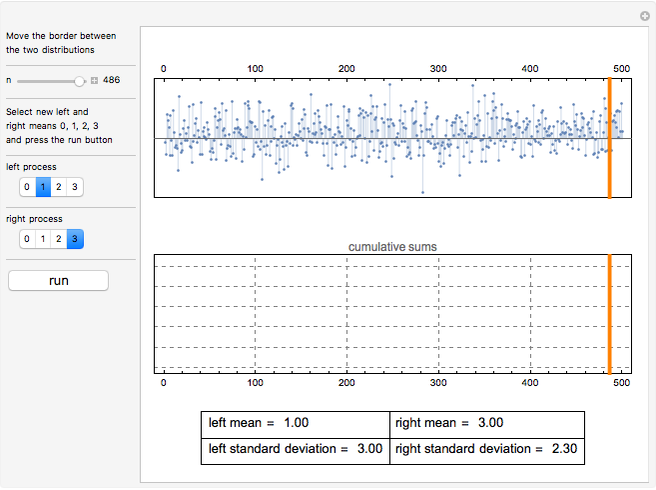
This Demonstration illustrates a simplified version of the method of cumulative sums (CUSUM). A dataset of the form  ,
,  , …,
, …,  is constructed by drawing the first
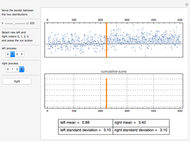
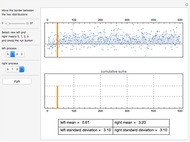
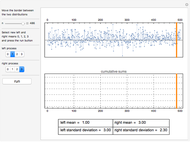
  observations at random from a normal distribution with mean specified by the "left process" control and the remainder from a normal distribution with mean specified by the "right process" control. The standard deviation in both cases is 3. The top graph shows the dataset, while the bottom graph shows the cumulative sums of the dataset (i.e., the values
  ,
,  , …,
, …,  where
where  ). It is arguably easier to detect the boundary between the two processes from the second plot than from the first.
Contributed by: Olexandr Eugene Prokopchenko and Pylyp Prokopchenko (September 2012)
Open content licensed under CC BY-NC-SA
Snapshots
Details
detailSectionParagraphPermanent Citation
"Cumulative Sums and Visual Change Detection between Two Random Processes"
http://demonstrations.wolfram.com/CumulativeSumsAndVisualChangeDetectionBetweenTwoRandomProces/
Wolfram Demonstrations Project
Published: September 19 2012
 Distance Distributions in Finite Uniformly Random Point Processes
Sunil Srinivasa and Martin Haenggi Random Number Generation
Hector Zenil Mean-Reverting Random Walks
Jason Cawley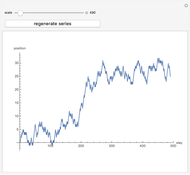 Self-Similarity in Random Walk
Hiroki Sayama Generic Random Walk and Maximal Entropy Random Walk
Bartlomiej Waclaw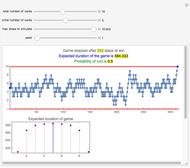 A Reluctant Random Walk
Heikki Ruskeepää Entropy of a Message Using Random Variables
Daniel de Souza Carvalho Degree Distribution on a Random Network
Jorge Villalobos Goodness of Fit for Random Subsets
Michael Rogers (Oxford College of Emory University)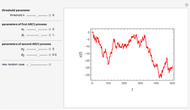 Two-Regime Threshold Autoregressive Model Simulation
Jozef Barunik