Different Perspectives on the Median of a Distribution


Requires a Wolfram Notebook System
Interact on desktop, mobile and cloud with the free Wolfram Player or other Wolfram Language products.
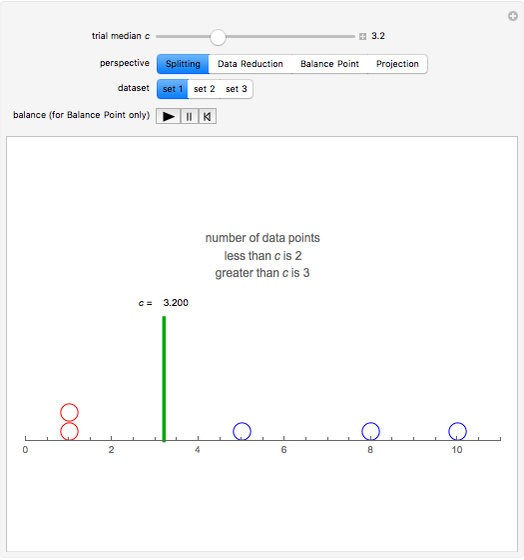
Using three small datasets, we explore four different perspectives of the median. Within each perspective, use the slider to choose the parameter  that gives the desired version of the median.
Contributed by: Alexander White and Lawrence M. Lesser (July 2016)
Open content licensed under CC BY-NC-SA
Snapshots

Details
The standard convention for computing the median for a dataset is the following sequence:
1. Sort the data.
2a. If the size of the set is odd, choose the middle value.
2b. If the size of the set is even, average the middle pair of values.
The step 2b insures that we have a unique value for each dataset. However, if we think of the median as the number fulfilling a particular goal, such as “split the data in half,” the number may not be unique. For each perspective in this Demonstration, the choice of the median achieves a particular goal.
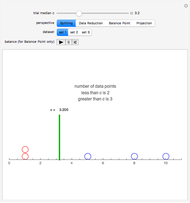
Snapshot 1. Splitting: Circles on the number line represent data values. We wish to split the data into two equally sized sets. Slide so that the number of data points above the median and the number below the median are equal. Is this possible in dataset 2? Why or why not? How can you modify the criteria to work for all datasets?
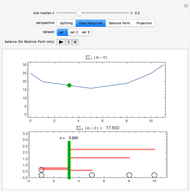
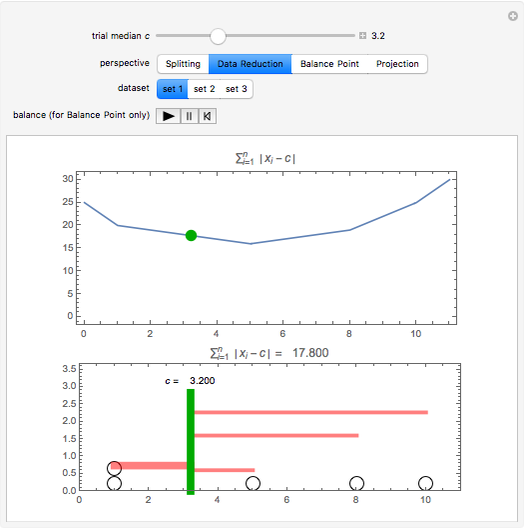
Snapshot 2: Data Reduction. Find the value closest to the data. The upper graph shows the sum of the absolute deviations from  In the lower graph, circles on the number line represent data values. Each red line represents the distance from an observation to . The thickness of the line is proportional to the number of data points at that distance. Choose to minimize the sum of absolute deviations. Note this is equivalent to minimizing the mean absolute deviation. Is there a unique minimizer for dataset 3? Why or why not?
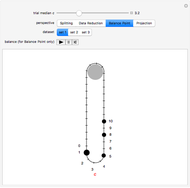
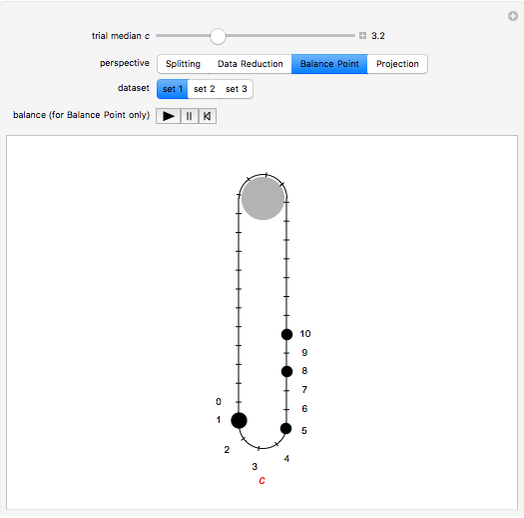
Snapshot 3: Balance Point. The circles represent data values on a number line that has been tied into a loop and placed on a pulley Lynch(2009). The diameter (weight) of the circle is proportional to the number of data points at that value. If the loop is rotated and released, the loop will adjust until a median is at the lowest point of the loop. Slide to a value, click the Play trigger and see the loop move into equilibrium. Reset (with the third button) and try again with another value of . What happens when is far from the median? For dataset 3, what happens when is between the two middle ordered values?
Reference
Mark Lynch, “Teaching Tip: The Median is a Balance Point,” The College Mathematics Journal, 40(4), 2009 p. 292.
Permanent Citation
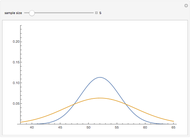 Distribution of Normal Means with Different Sample Sizes
David Gurney Median Split
Gary McClelland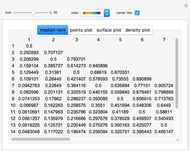 Visualizing the Exact Median Rank
Frederick Wu The Normal Distribution
Gary H. McClelland The Sampling Distribution of a Sampling Quantile
Seth J. Chandler Sampling Distribution of the Sample Mean
Jim R Larkin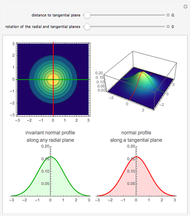 Rotational Symmetry of Multivariate Uncorrelated Standard Normal Distribution
Diego M. Oviedo-Salcedo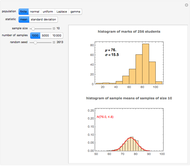 Sampling Distribution of the Mean and Standard Deviation in Various Populations
Ian McLeod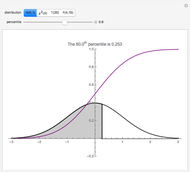 Percentiles of Certain Probability Distributions
Chris Boucher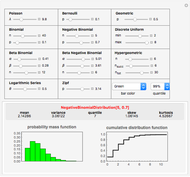 Mathematica 7's Discrete Distributions
Nasser M. Abbasi