Dynamics of a Deterministic Overflow Fluid Network


Requires a Wolfram Notebook System
Interact on desktop, mobile and cloud with the free Wolfram Player or other Wolfram Language products.
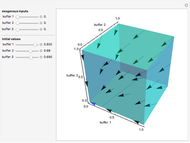
This Demonstration shows how buffers behave for a deterministic overflow fluid network consisting of three nodes. In this network, each node has a buffer in front of it. On the three axes it is shown how full the buffers are: between 0 (empty) and 1 (full). In this network the fluid that is processed by a node is either routed to another node in the network or leaves the network. If a buffer is full, the fluid that cannot enter this buffer is rerouted as well. Beside the fluid that is routed to a node, the nodes also have an exogenous input.
[more]
Contributed by: Stijn Fleuren (March 2011)
Open content licensed under CC BY-NC-SA
Snapshots


Details
Snapshot 1: all buffers have a small exogenous input and therefore are eventually empty
Snapshot 2: eventually buffers 1 and 2 are full and buffer 3 is empty
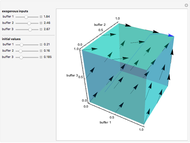
Snapshot 3: all buffers have a large exogenous input and therefore are eventually full
Symbolizing the Network
You can think of this network as three funnels that are connected to each other with pipes.
A funnel symbolizes the node including its buffer.
The size of the hole at the bottom of the funnel defines how much fluid per time unit can leave the funnel. (In this Demonstration each node (funnel) can process 1.1 fluid per time unit.)
The size of the funnel itself defines how much material it could contain before it starts overflowing. (In this Demonstration the buffer capacity is 1.)
Each node receives an exogenous input. This exogenous input can be symbolized with a tap that pours fluid into the funnel.
The pipes transport fluid from one funnel to another and symbolize the routing in the network. These pipes transport fluid that leaves the hole at the bottom of the funnel but they also transport fluid that overflows (if the funnel is full).
Purpose
This Demonstration shows the effect of changing the exogenous inputs on the behavior of the buffers. If you pour more fluid into the buffer, do the buffers fill up or empty?
The effect of changing the initial amount of material inside the buffers is also shown.
Routing
Fluid that is processed by a node is routed to another node according to the routing matrix  . The
. The  entry of this matrix defines what proportion of the fluid goes to node
  after the material is processed by node
  . Thus from the fluid that is processed by node 1, 0.1 goes to node 2, 0.1 goes to node 3, and 0.8 leaves the network.
The fluid that could not enter a buffer is routed to another node according to routing matrix  . Here the entry defines what proportion goes to node after the fluid could not enter buffer because it was full. For example, in this network 0.7 of the fluid that overflows at node 1 is routed to node 2 and 0.2 is routed to node 3. The remaining 0.1 leaves the system.
Permanent Citation
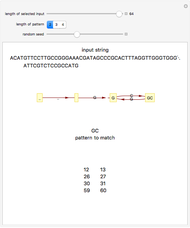 String Matching Automaton
Michael Schreiber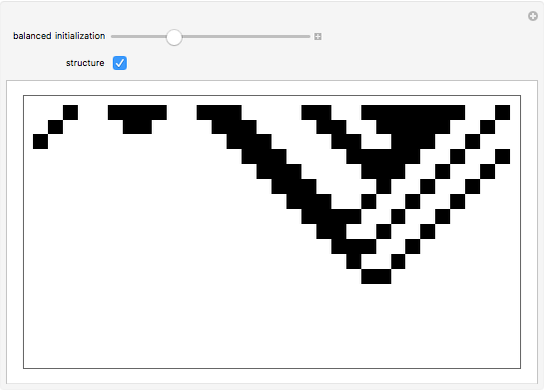 Balanced Annihilation
Michael Schreiber Dynamical Network Design for Controlling Virus Spread
Mengran Xue, Yan Wan, Sandip Roy, and Ali Saberi Dynamic Proximity Networks
Seth J. Chandler Network Motifs and Graphlets
Hector Zenil Neighbor-Dependent Network Systems
Abigail Nussey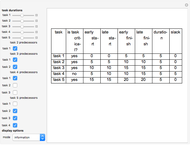 Gantt Charts and Network Diagrams
Anthony I. Joseph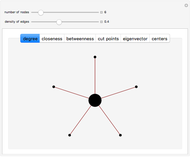 Measures of Network Centrality
Phillip Bonacich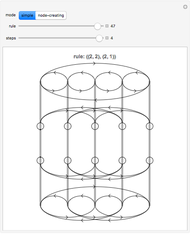 Two Types of Network Systems
Abigail Nussey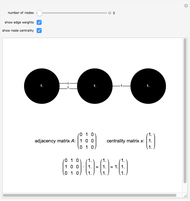 Network Centrality Using Eigenvectors
Brian Levinstein