Gantt Charts and Network Diagrams


Requires a Wolfram Notebook System
Interact on desktop, mobile and cloud with the free Wolfram Player or other Wolfram Language products.
Gantt charts and network diagrams are commonly used tools in project management to schedule tasks within a project. By varying individual task predecessors and task durations, this Demonstration allows for a simple exploration of basic project management concepts, such as determining project duration, the critical path, and total slack. Changes can be observed in the project network, Gantt chart, and a summary table. On the Gantt chart, task durations are indicated in black and slack time in gray.
Contributed by: Anthony I. Joseph (December 2007)
Open content licensed under CC BY-NC-SA
Snapshots


Details
Project management is the set of skills applied to control and monitor a team's progress through a project. An example of these skills is managing project scheduling, where tasks within a project are given durations and prerequisites are determined.
In this Demonstration there are five tasks. One or several tasks can depend on other tasks; for example, the task of "watching a film at the cinema" has a prerequisite of "purchasing ticket" and "getting snacks", where both tasks need to be completed before you can watch a film. The "network diagram" is referred to as an "activity-on-node" diagram, where tasks are performed on the nodes of the graph. It is very important to observe that task durations have no effect on this diagram. Network diagrams only indicate task dependencies (as shown in Snapshot 2).
The Gantt chart indicates the interrelationship between task durations and precedence. Task durations are indicated in black. Snapshot 2 shows the duration of the tasks that can only start when prerequisite tasks are complete, and upon completion allow other tasks to be completed. Tasks may have several prerequisites.
However, it is possible that there is an opportunity to delay the start of a task without impacting the project duration. This is referred to as slack time, and is indicated by gray bars on the Gantt chart. Tasks that have no slack (in Snapshot 2, these are tasks 1, 2, 3, and 5) are referred to as critical tasks; delaying these tasks will delay the time to finish the project. Therefore, the critical path is the set of critical tasks, and the sum of task durations on the critical path is the project duration. This process is called the critical path method (CPM).
However, the project's duration is equally calculated by determining the longest possible path through the project network. Therefore, it is not possible to have loops within the project. For example, if you need to "view car speedometer" and "alter car speed" (two activities that form a feedback loop), then this cannot be depicted in a network diagram and CPM cannot be performed (as the project duration, in theory, will be infinite). A practical method of bypassing this dilemma is to create a master task (in the example, this can be "drive car") and give this master task a fixed duration.
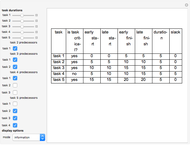
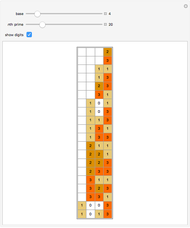
Snapshot 3 shows a summary table showing key information for each task: a task's early start (the earliest time a task can commence), late start (the latest time a task can commence), early finish (the earliest time a task can finish if started at the earliest start time), late finish (the latest time a task can finish if started at the latest time), and slack time (the difference between the late finish and early finish, or late start and early start). A task's duration is the difference between the early finish and early start, or the late finish and late start.
For more information about project management, see the Project Management Institute, especially the Project Management Body of Knowledge (PMBoK, a part of IEEE standard 1490-2003). Or see any local project management organization, such as the Australian Institute of Project Management.
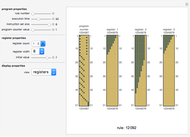
Snapshot 1: Gantt chart of example project (display mode = "Gantt chart")
Snapshot 2: network diagram of example project (display mode = "network diagram")
Snapshot 3: summary table of example project (display mode = "information")
Permanent Citation
"Gantt Charts and Network Diagrams"
http://demonstrations.wolfram.com/GanttChartsAndNetworkDiagrams/
Wolfram Demonstrations Project
Published: December 7 2007
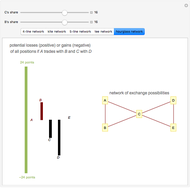 The Power-Dependence Solution to Five Exchange Networks
Phillip Bonacich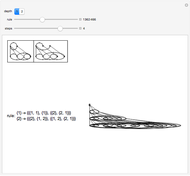 Neighbor-Dependent Network Systems
Abigail Nussey Two Types of Network Systems
Abigail Nussey Network Motifs and Graphlets
Hector Zenil Hopfield Network with State-Dependent Threshold
Vaibhav Vavilala and Yogesh Joglekar Neural Network for a Basic Truth Table
Alexander Isakov Dynamical Network Design for Controlling Virus Spread
Mengran Xue, Yan Wan, Sandip Roy, and Ali Saberi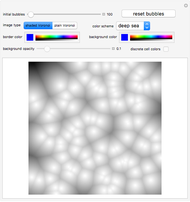 Foam Bubbles Simulating Voronoi Diagrams
Suzie Byun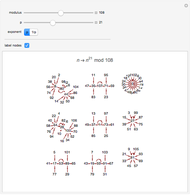 State Transition Diagrams for Modular Powers
Stephen Wolfram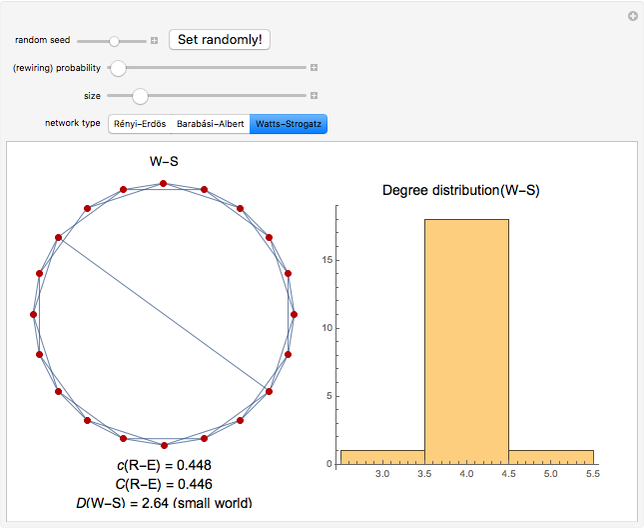 Complex Networks
Hector Zenil