Enzyme Inhibition Kinetics


Requires a Wolfram Notebook System
Interact on desktop, mobile and cloud with the free Wolfram Player or other Wolfram Language products.
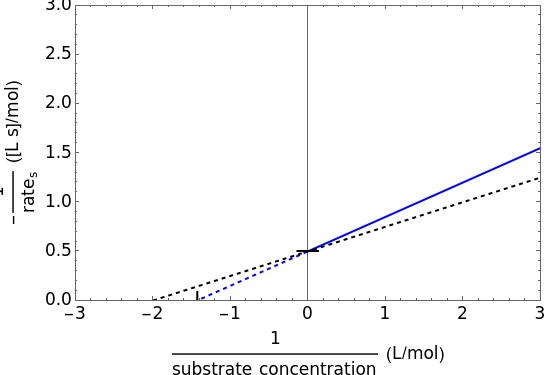
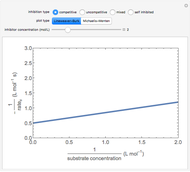
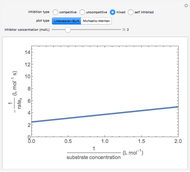
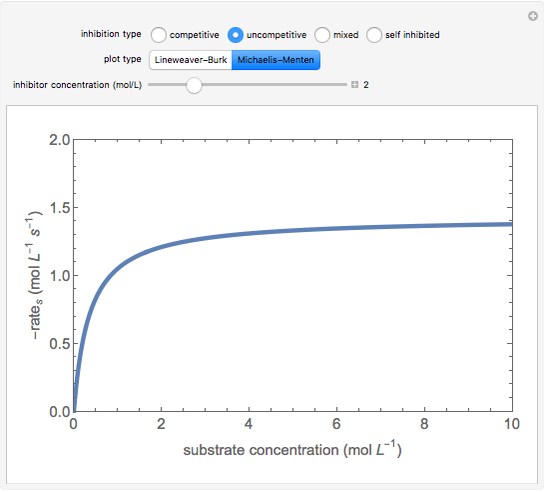
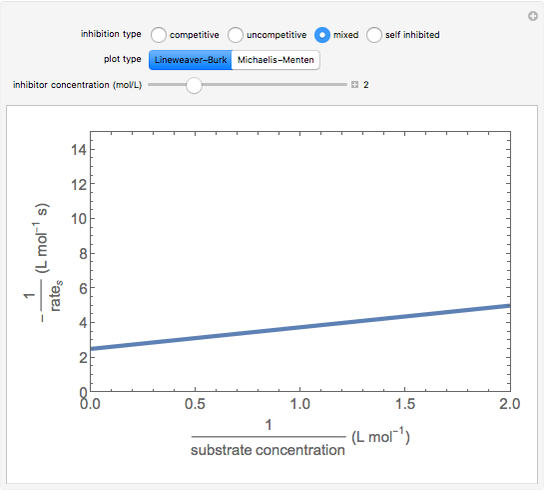
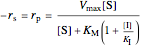
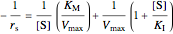
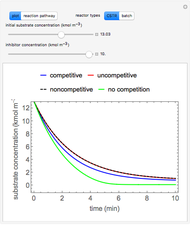
This Demonstration plots rate data for Michaelis–Menten enzyme kinetics for four types of inhibition. For competitive inhibition, an inhibitor forms an inactive complex with the enzyme. For uncompetitive inhibition, an inhibitor forms an inactive complex with the enzyme-substrate complex. For mixed inhibition, the inhibitor forms both types of inactive complexes. For self-inhibition, the substrate itself inhibits the reaction by forming an inactive complex with the enzyme-substrate complex.
[more]

Contributed by: Nicholas R. Larson (March 2014)
With additional contributions by: Rachael L. Baumann, John L. Falconer, and Nick Bongiardina
(University of Colorado Boulder, Department of Chemical and Biological Engineering)
Open content licensed under CC BY-NC-SA
Snapshots


Details
Reaction Pathways
 values come from respective reaction coefficients
 represents the concentration of an enzyme-substrate complex
 represents the concentration of an enzyme-inhibitor complex
 represents the concentration of an enzyme-inhibitor-substrate complex
 is the total enzyme concentration
 ,
,
 ,
,
 .
.
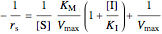
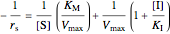
The Linweaver–Burk method in a method of linearizing experimental data. The slope and  intercept from experimental data can be used to determine
  ,
,  , and
, and  from plotted data.
The line is given by
 ,
,
where  is the slope,
  is the intercept, and
  is the
  intercept (the value of when
  ).
).
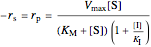
Competitive Inhibition: The inhibitor competes with the substrate for the enzyme to form an inactive complex.
(1)  (2)
(2)  (3)
(3)  (4)
(4)  (inactive)
(5)
(inactive)
(5) 
 ,
,
 ,
,
 ,
,
 ,
,
 .
.
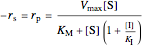
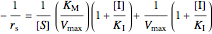
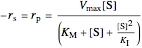
Uncompetitive (Anti-Competitive) Inhibition: The inhibitor binds to the enzyme-substrate complex forming an inhibitor-enzyme-substrate complex.
(1)
(2)
(3)
(4)  (inactive)
(5)
(inactive)
(5) 
 ,
,
 ,
,
 ,
,
 ,
,
 .
.
Noncompetitive Inhibition (Mixed Inhibition): Mixed inhibition is most commonly seen for enzymes with two or more substrates. The inhibitor can bind to the enzyme or enzyme-substrate complex. The substrate can also bind to the inhibitor-enzyme complex.
(1)  (2)
(2)  (inactive)
(3)
(4)
(inactive)
(3)
(4)  (inactive)
(5)
(inactive)
(5)  (inactive)
 ,
,
 ,
,
,
,
 .
.
Substrate Inhibition: In the case of uncompetitive inhibition, the inhibitor ties up the enzyme-substrate complex to form an inactive substrate-enzyme-substrate complex.
(1)
(2)
(3)
(4)  (inactive)
(5)
(inactive)
(5) 
 ,
,
 ;
;
this plot in not linear because the intercept depends on the substrate concentration  .
.
Reference
[1] H. S. Fogler, Essentials of Chemical Reaction Engineering, 1st ed., Upper Saddle River, NJ: Pearson Higher Education, 2010 pp. 364–370.
Permanent Citation
 Inhibition of Enzyme Reactions in Continuous Stirred-Tank Reactor and Batch Reactor
Rachael L. Baumann Pharmacokinetic Modeling
Nicholas R. Larson Attainable Region for van de Vusse Kinetics
Housam Binous, Brian G. Higgins, and Ahmed Bellagi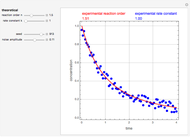 Estimating Kinetic Parameters from a Batch Reactor Experiment
Housam Binous, Ahmed Bellagi, and Brian G. Higgins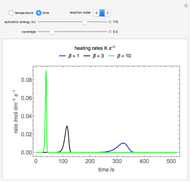 Temperature-Programmed Desorption
Rachael L. Baumann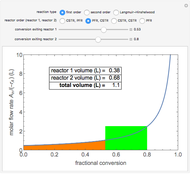 Minimized Volume for Reactors in Series
Nicholas R. Larson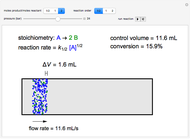 Volumetric Flow Rates in a Plug Flow Reactor
Rachael L. Baumann and Adam J. Johnston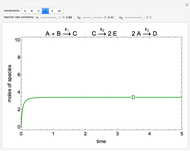 Batch Reactor with Multiple Reactions
Rachael L. Baumann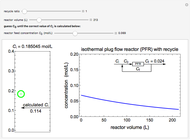 Isothermal Plug Flow Reactor with Recycle
Rachael L. Baumann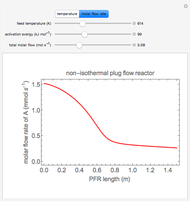 Parametric Sensitivity of Plug Flow Reactor With Heat Exchange
Rachael L. Baumann
