Keynesian Cross Diagram


Requires a Wolfram Notebook System
Interact on desktop, mobile and cloud with the free Wolfram Player or other Wolfram Language products.
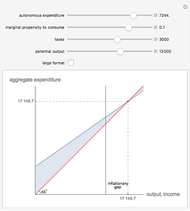
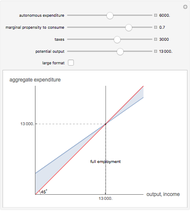
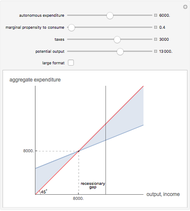
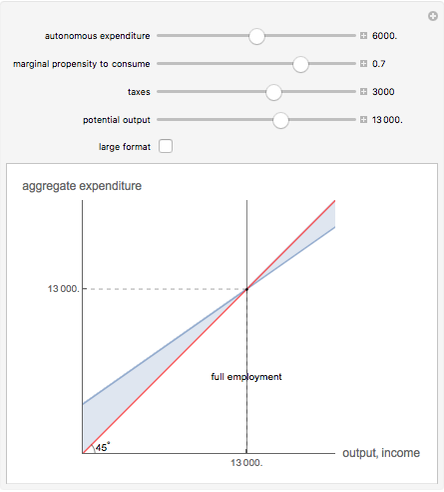
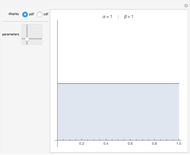
Samuelson's Keynesian cross diagram is an attempt to capture the essence of Keynes' theory of effective demand. The blue line represents aggregate expenditure on domestically produced goods and services. Of all the components of aggregate expenditure, only the level of consumption is assumed to be a function of income; the other components are assumed to be autonomous. The red  line expresses the accounting identity that aggregate expenditure is equal to national income. The model shows that a change in autonomous expenditure leads to a larger-sized change in national income, a relationship known as the multiplier effect.
Contributed by: Fiona Maclachlan (March 2011)
Open content licensed under CC BY-NC-SA
Snapshots


Details
detailSectionParagraphPermanent Citation
"Keynesian Cross Diagram"
http://demonstrations.wolfram.com/KeynesianCrossDiagram/
Wolfram Demonstrations Project
Published: March 7 2011
 The Keynesian IS-LM Model
William J. Polley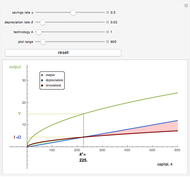 Simple Solow Model
Alex Tabarrok Solow Growth Model
Fiona Maclachlan Money Supply Process
Fiona Maclachlan Dynamics in the Solow-Swan Growth Model
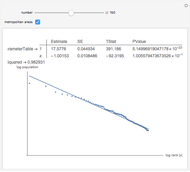
Richard Foltyn Revenue and Elasticity
Fiona Maclachlan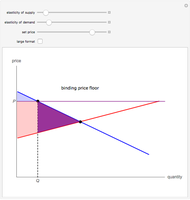 Price Controls
Fiona Maclachlan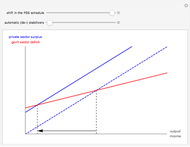 Automatic Stabilizers in Krugman's Cross Diagram
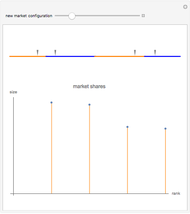
Kevin W. Capehart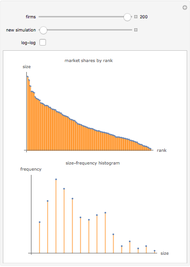 A Model of Market Shares II
Fiona Maclachlan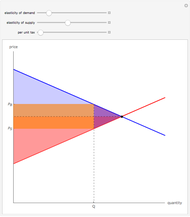 Per Unit Tax
Fiona Maclachlan
-
 Zipf's Law for U.S. Cities
Fiona Maclachlan -
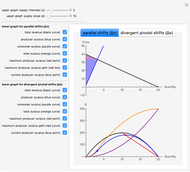 How Continuous Innovation Affects Supply, Producer Surplus, and Consumer Surplus
Fiona Maclachlan -
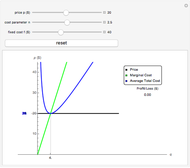
 Monopoly Model
Fiona Maclachlan -
 Competitive Model
Fiona Maclachlan -
Simple Solow Model
Fiona Maclachlan -
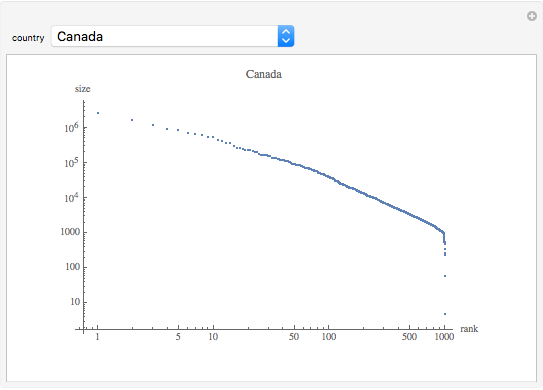 Zipf's Law for Cities
Fiona Maclachlan -
Money Supply Process
Fiona Maclachlan -
 A Model of Market Shares I
Fiona Maclachlan -
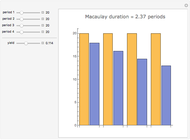 Macaulay Duration
Fiona Maclachlan -
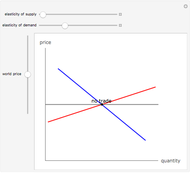 Gains from Trade
Fiona Maclachlan -
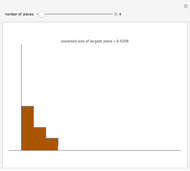 Broken Stick Rule
Fiona Maclachlan -
 Amortized Loan Interest and Principal
Fiona Maclachlan -
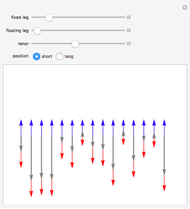 Interest Rate Swap
Fiona Maclachlan -
 Elasticity, Total Revenue, and the Linear Demand Curve
Fiona Maclachlan -
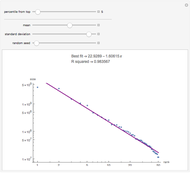 Power Law Tails in Log Normal Data
Fiona Maclachlan -
 Concentric Circles
Fiona Maclachlan -
 Long-Run Average Total Cost
Fiona Maclachlan -
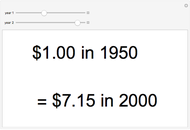 Purchasing Power Calculator
Fiona Maclachlan -
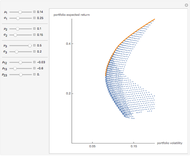 Three-Asset Efficient Frontier
Fiona Maclachlan -
 Beta Distribution
Fiona Maclachlan