Linear and Quadratic Curve Fitting Practice
Initializing live version


Requires a Wolfram Notebook System
Interact on desktop, mobile and cloud with the free Wolfram Player or other Wolfram Language products.
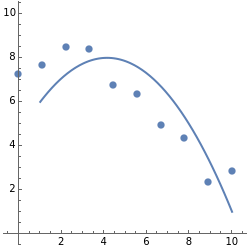
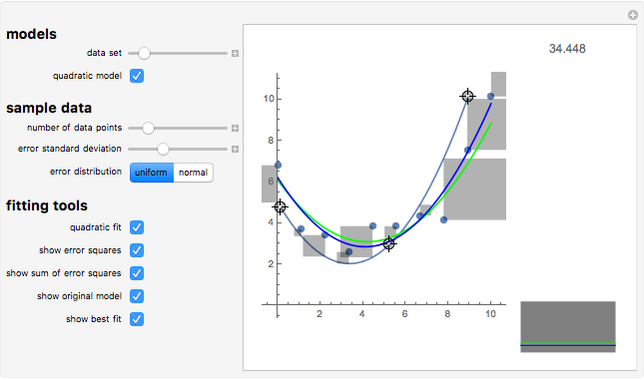
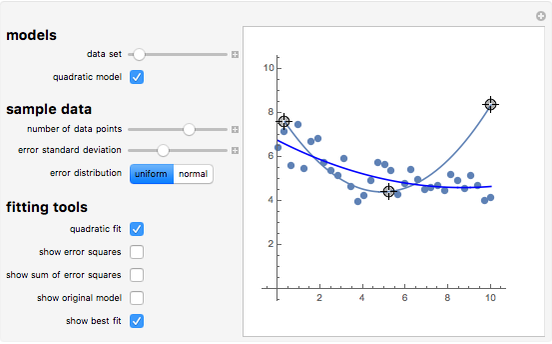
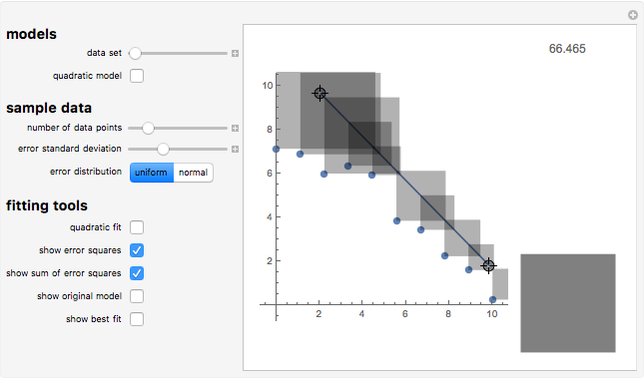
Practice fitting lines and curves to sample datasets, then compare your fit to the best possible.
[more]
Contributed by: Jon McLoone (March 2011)
Open content licensed under CC BY-NC-SA
Snapshots


Details
detailSectionParagraphPermanent Citation
"Linear and Quadratic Curve Fitting Practice"
http://demonstrations.wolfram.com/LinearAndQuadraticCurveFittingPractice/
Wolfram Demonstrations Project
Published: March 7 2011
Related Demonstrations
More by Author
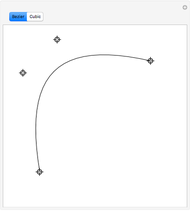 Simple Spline Curves
Richard Phillips and Rob Morris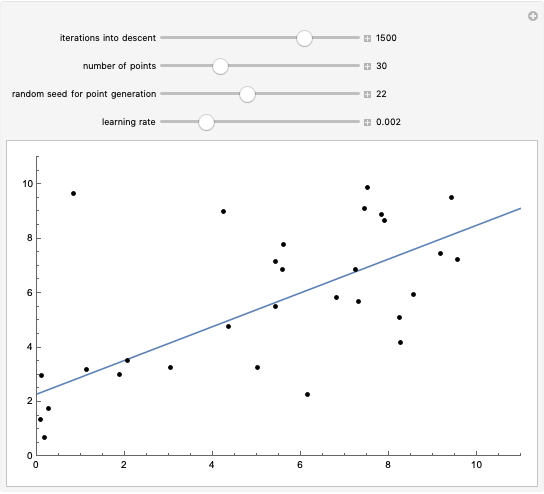 Linear Regression with Gradient Descent
Jonathan Kogan Cumulative Frequency Curves
Phil Ramsden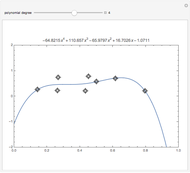 Curve Fitting
Theodore Gray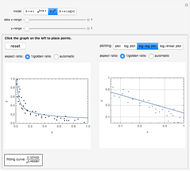 Interactive Curve Fitting
Janos Karsai (University of Szeged, Hungary) Mean, Fitted-Value, Error, and Residual in Simple Linear Regression
Ian McLeod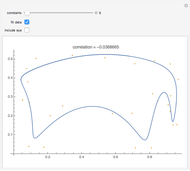 Fitting an Elephant
Roger J. Brown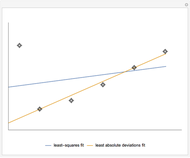 Comparing Least-Squares Fit and Least Absolute Deviations Fit
Frank Brechtefeld Fitting Noisy Data
Rob Morris Kernel Density Estimation
Jeff Hamrick
-
 Beat Frequency of Sound Waves
Jon McLoone -
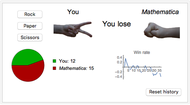 Rock, Paper, Scissors with AI Player
Jon McLoone -
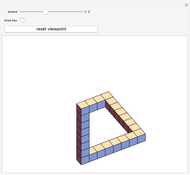 Near-Penrose Shapes
Jon McLoone -
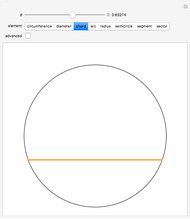 Geometric Elements of a Circle
Jon McLoone -
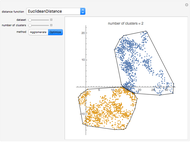 Cluster Analysis
Jon McLoone -
 Picture Puzzle
Jon McLoone -
 Hangman Word Game for a Human Player
Jon McLoone -
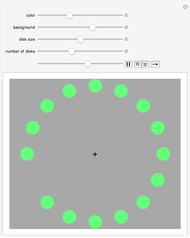 What Color is the Moving Circle?
Jon McLoone -
 Monte Carlo Estimate for Pi
Jon McLoone -
 Are the Lines Parallel?
Jon McLoone -
 Data Smoothing
Jon McLoone -
 Conformal Map of Exponential
Jon McLoone -
 Traveling Salesman Problem
Jon McLoone -
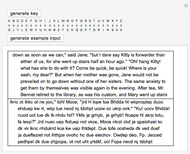 Cipher Encoder
Jon McLoone -
 Slider Puzzle
Jon McLoone -
 Interior Angles of a Triangle
Jon McLoone -
 Color Filters in Black and White Photography
Jon McLoone -
 Contrast Illusion
Jon McLoone -
 Book Reader
Jon McLoone -
 Populations of Cities
Jon McLoone