Molecular Pie Charts
Initializing live version


Requires a Wolfram Notebook System
Interact on desktop, mobile and cloud with the free Wolfram Player or other Wolfram Language products.
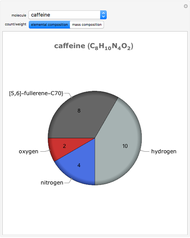
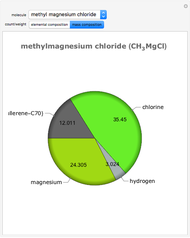
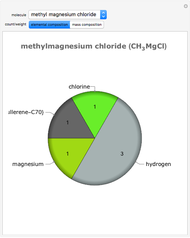
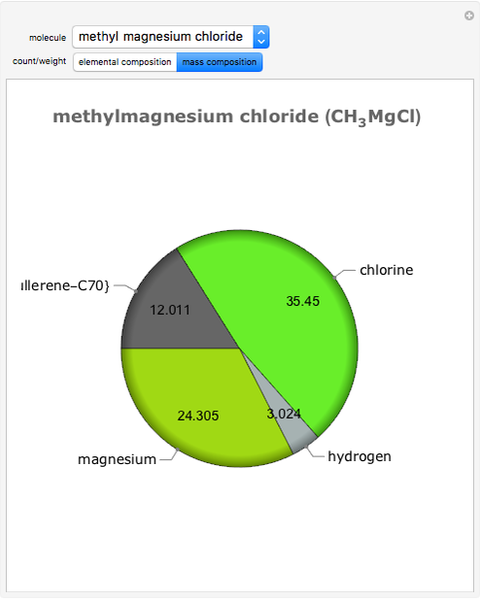
This shows the labeling and chart element functionality of PieChart, a new charting function in Mathematica 7.
Contributed by: Adam Griffith (March 2011)
Open content licensed under CC BY-NC-SA
Snapshots


Details
detailSectionParagraphPermanent Citation
"Molecular Pie Charts"
http://demonstrations.wolfram.com/MolecularPieCharts/
Wolfram Demonstrations Project
Published: March 7 2011
Related Demonstrations
More by Author
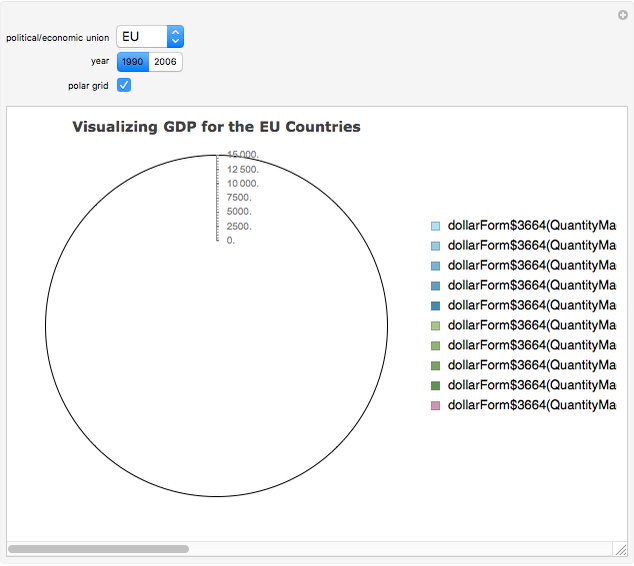 SectorChart Applied to GDP
Brett Champion and Adam Griffith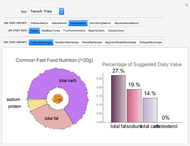 Stylized Pie and Bar Charts for Fast Food Nutrition
MinHsuan Peng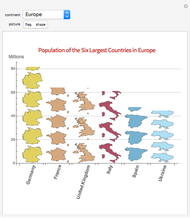 Pictorial Bar Charts
Adam Griffith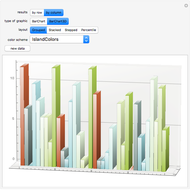 Charting with BarChart
Bernard Vuilleumier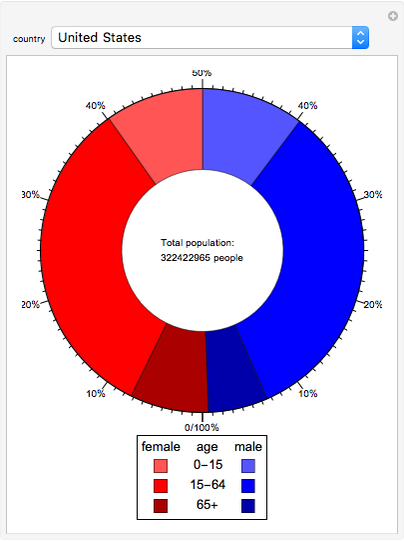 Population Donut Chart
Brett Champion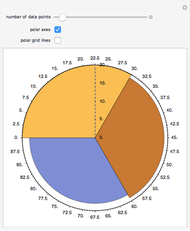 SectorChart
Adam Griffith Image Processing on Partitions
Nick Lariviere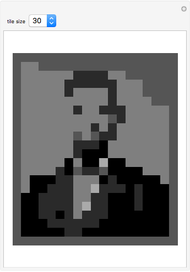 Guess Who?
Ken Levasseur (UMass Lowell)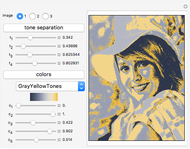 Posterization of Grayscale Images
Erik Mahieu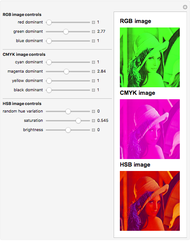 Playing with Image Channels
Riccardo Vincenzo Vincelli
