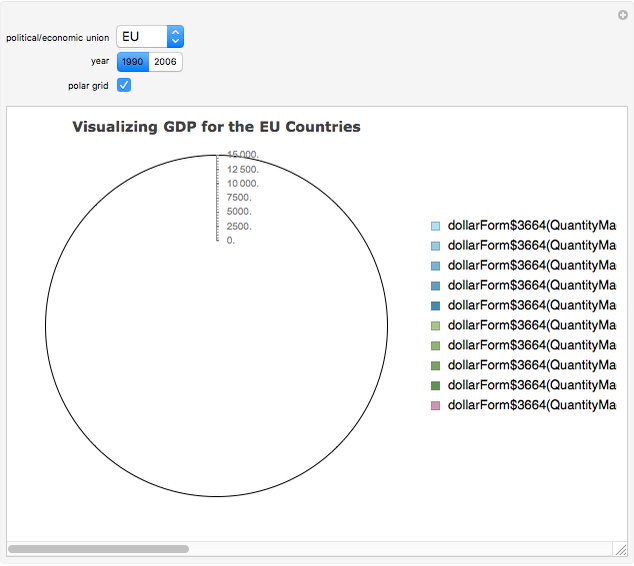
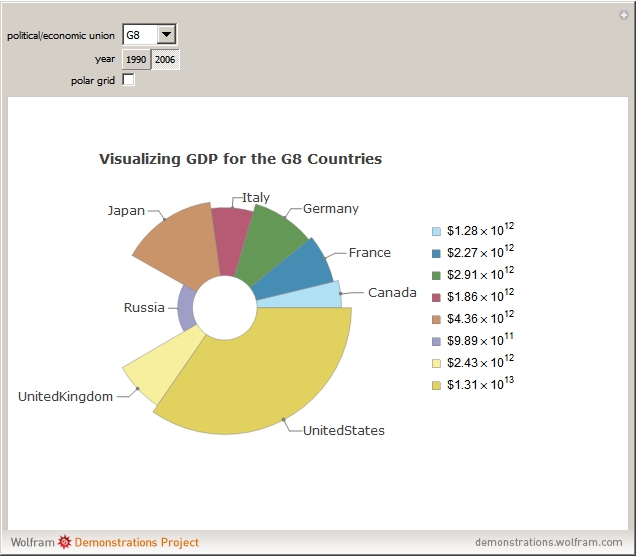
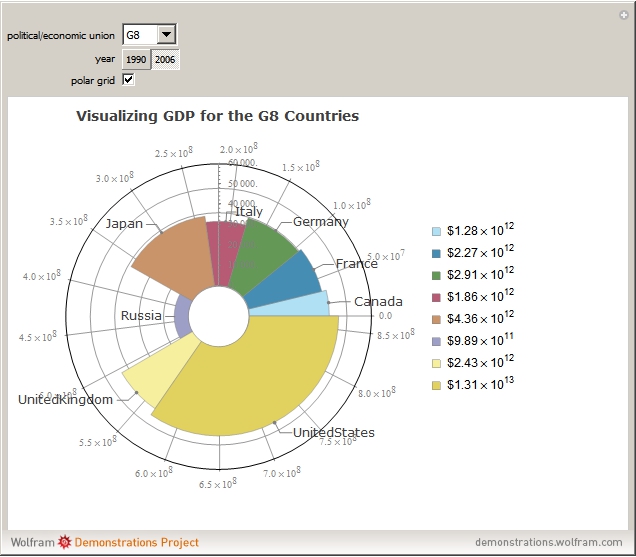
SectorChart Applied to GDP


Requires a Wolfram Notebook System
Interact on desktop, mobile and cloud with the free Wolfram Player or other Wolfram Language products.
This shows the 1990 and 2006 GDP (gross domestic product) of three groups of countries, the EU (European Union), the G8 (Group of Eight), and OPEC (Organization of Oil Producing Countries). Arc length is proportional to population and radial distance represents per capita GDP in U.S. dollars. The legend shows the total GDP in U.S. dollars for each country.
Contributed by: Brett Champion and Adam Griffith (December 2008)
Open content licensed under CC BY-NC-SA
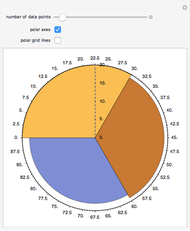
Snapshots
Details
detailSectionParagraphPermanent Citation
"SectorChart Applied to GDP"
http://demonstrations.wolfram.com/SectorChartAppliedToGDP/
Wolfram Demonstrations Project
Published: December 7 2008
 SectorChart
Adam Griffith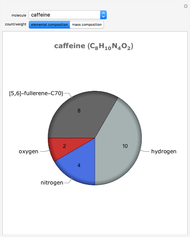 Molecular Pie Charts
Adam Griffith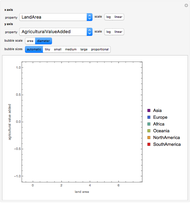 Bubble Chart Comparisons of Countries
Brett Champion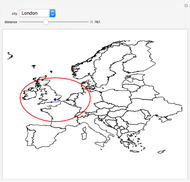 Forward Problem Solved with GeoDestination
Joshua Martell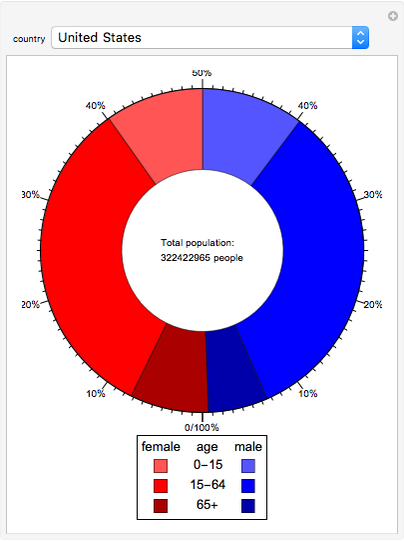 Population Donut Chart
Brett Champion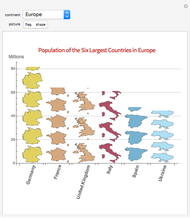 Pictorial Bar Charts
Adam Griffith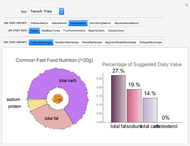 Stylized Pie and Bar Charts for Fast Food Nutrition
MinHsuan Peng Image Processing on Partitions
Nick Lariviere Guess Who?
Ken Levasseur (UMass Lowell)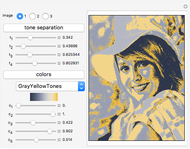 Posterization of Grayscale Images
Erik Mahieu