SectorChart


Requires a Wolfram Notebook System
Interact on desktop, mobile and cloud with the free Wolfram Player or other Wolfram Language products.
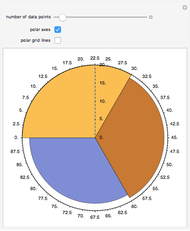
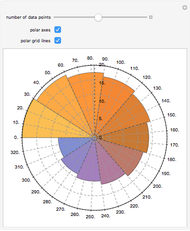
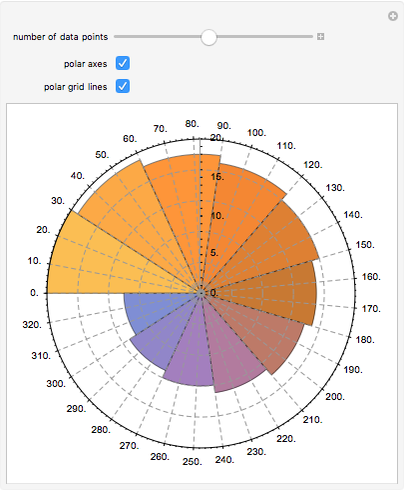
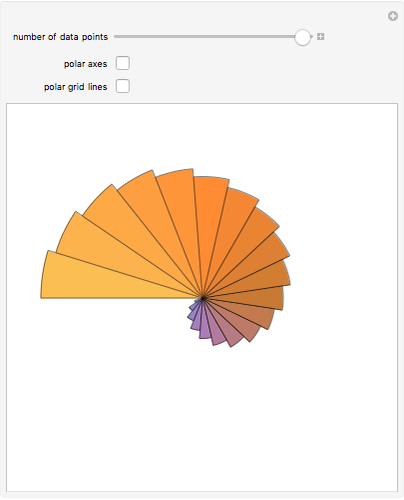
When curating data, sometimes it is easier to see patterns if you use a sector plot instead of the classic Cartesian coordinate system. Here is an example of a sector plot with sector angles proportional to  and radii proportional to
  for
for  values ranging from 30 to the number of data points. The curve is spiraling inward while the angle remains constant. Thus from a visual inspection, it is evident that a negative linear relationship is present.
Contributed by: Adam Griffith (March 2011)
Open content licensed under CC BY-NC-SA
Snapshots


Details
detailSectionParagraphPermanent Citation
"SectorChart"
http://demonstrations.wolfram.com/SectorChart/
Wolfram Demonstrations Project
Published: March 7 2011
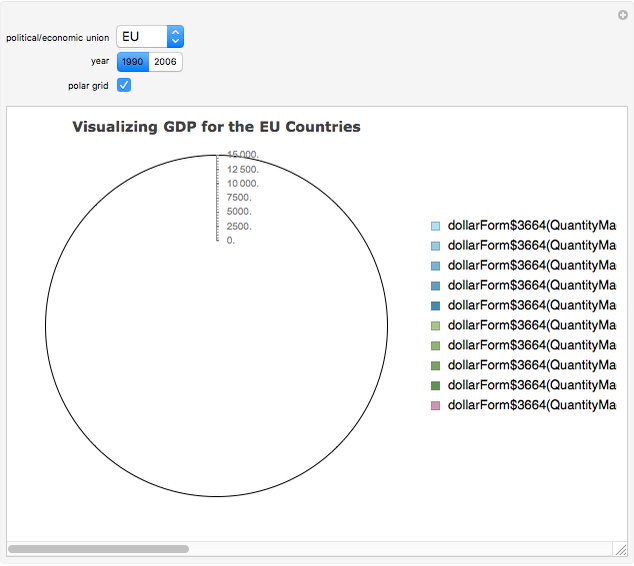 SectorChart Applied to GDP
Brett Champion and Adam Griffith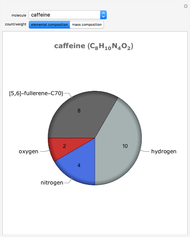 Molecular Pie Charts
Adam Griffith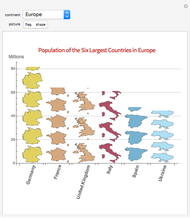 Pictorial Bar Charts
Adam Griffith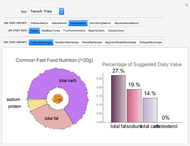 Stylized Pie and Bar Charts for Fast Food Nutrition
MinHsuan Peng Image Processing on Partitions
Nick Lariviere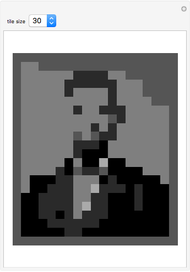 Guess Who?
Ken Levasseur (UMass Lowell)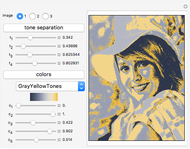 Posterization of Grayscale Images
Erik Mahieu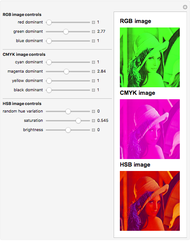 Playing with Image Channels
Riccardo Vincenzo Vincelli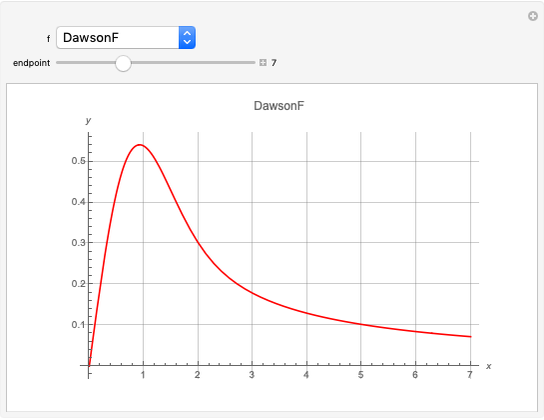 11 New Numerical Functions in Mathematica 7
Osman Tuna Gökgöz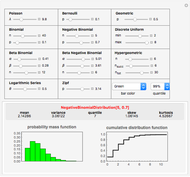 Mathematica 7's Discrete Distributions
Nasser M. Abbasi
