November 7, 2012


Requires a Wolfram Notebook System
Interact on desktop, mobile and cloud with the free Wolfram Player or other Wolfram Language products.
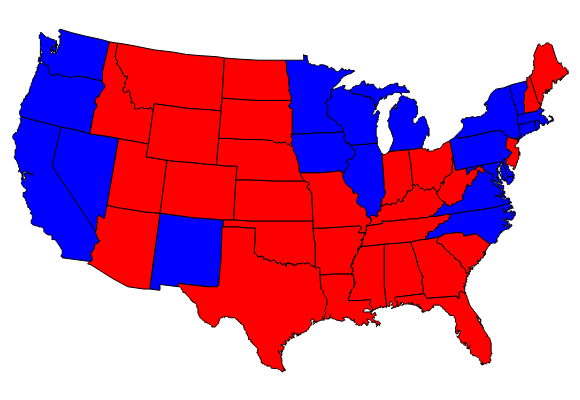
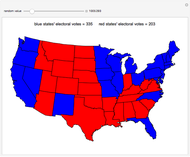
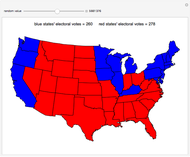
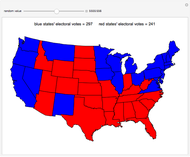
The next US presidential election will be held Tuesday, November 6, 2012. The election map might look like one of the maps randomly generated by this Demonstration. Red states represent the Republican Party and blue states represent the Democratic Party. In the actual election, Utah and Wyoming will very likely wind up being red states, while Illinois and Delaware will very likely be blue states. Most of the map changes occur in the battleground states, such as Florida, Iowa, and Ohio. Running millions of random trials allows an analysis of possible election day events, based on the reliability of the state-by-state odds.
[more]
Contributed by: Ed Pegg Jr (August 2012)
Open content licensed under CC BY-NC-SA
Snapshots


Details
State-by-state predictions were based on data from Nate Silver's New York Times blog [1]. Each candidate was given at least a 1% chance of winning any state. Effects for states that split the electoral votes, such as Nebraska, were not considered.
References
[1] N. Silver, "State-by-State Probabilities," FiveThirtyEight: Nate Silver's Political Calculus (blog). (Aug 21, 2012) fivethirtyeight.blogs.nytimes.com.
[2] J. Lietz. "Tornado Activity in the U.S. 1950–2007" from the Wolfram Demonstrations Project—A Wolfram Web Resource. www.demonstrations.wolfram.com/TornadoActivityInTheUS19502007.
Permanent Citation
"November 7, 2012"
http://demonstrations.wolfram.com/November72012/
Wolfram Demonstrations Project
Published: August 27 2012
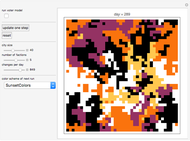 Voter Model
Ed Pegg Jr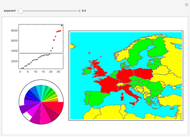 Europe Vote Exponent
Michael Schreiber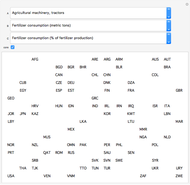 World Bank Data Series Overview
Michael Schreiber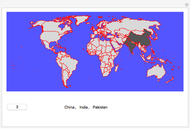 Click a Country
Michael Schreiber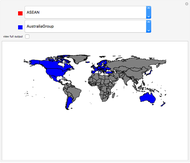 Members of International Organizations
Michael Schreiber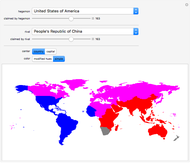 Hegemonic Zones of Influence
Michael Schreiber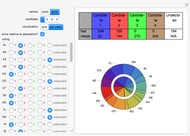 The Banzhaf Power Index of States for Presidential Candidates
Seth J. Chandler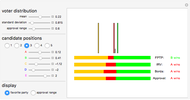 Comparing Voting Systems for a Normal Distribution of Voters
Adam Rumpf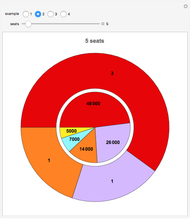 Parliamentary Seat Allocation by the Sainte-Laguë Method
Helmut Knaust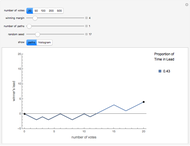 The Ballot Problem
Jose Sanchez and Madina Bolat
-
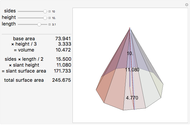 Right Pyramid Volume and Surface Area
Ed Pegg Jr -
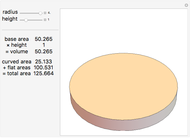
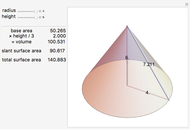 Right Cone Volume and Area
Ed Pegg Jr -
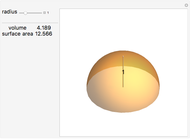 Hemisphere Volume and Surface Area
Ed Pegg Jr -
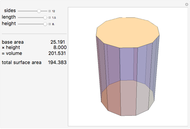
 Cylinder Volume and Area
Ed Pegg Jr -
 Regular Prism Volume and Surface Area
Ed Pegg Jr -
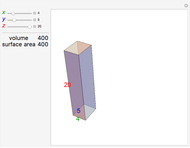 Box Volume and Surface Area
Ed Pegg Jr -
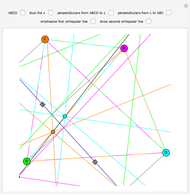 Orthopolar Lines for a Quadrilateral
Ed Pegg Jr -
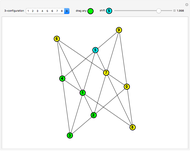 The Nine 10_3 Configurations
Ed Pegg Jr -
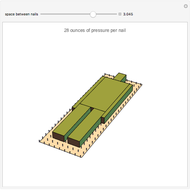 Bed of Nails
Ed Pegg Jr -
 Box Toppling Patterns
Ed Pegg Jr -
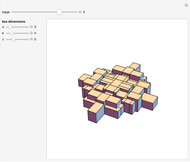
 Box Packing
Ed Pegg Jr -
 Sphere Volume and Area
Ed Pegg Jr -
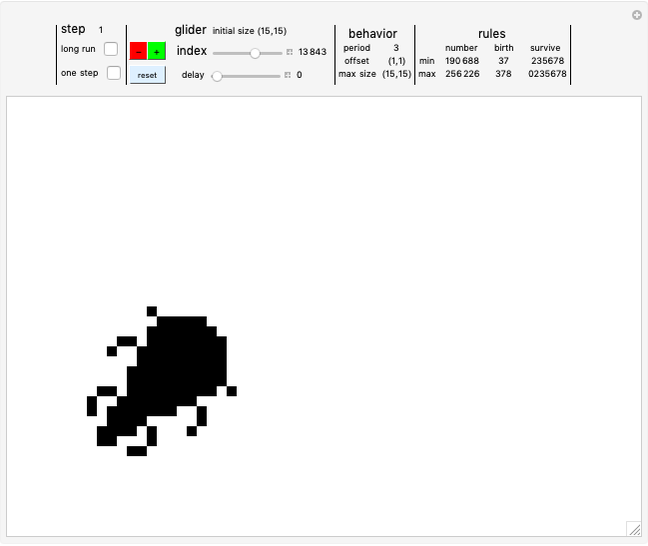 2D CA Glider Database
Ed Pegg Jr -
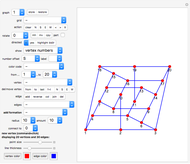 Constructing and Manipulating Graphs
Ed Pegg Jr -
 Acute Sets in Euclidean Spaces
Ed Pegg Jr -
 Moser Spindles, Golomb Graphs and Root 33
Ed Pegg Jr -
 GL(3,n) Acting on 3D Points
Ed Pegg Jr -
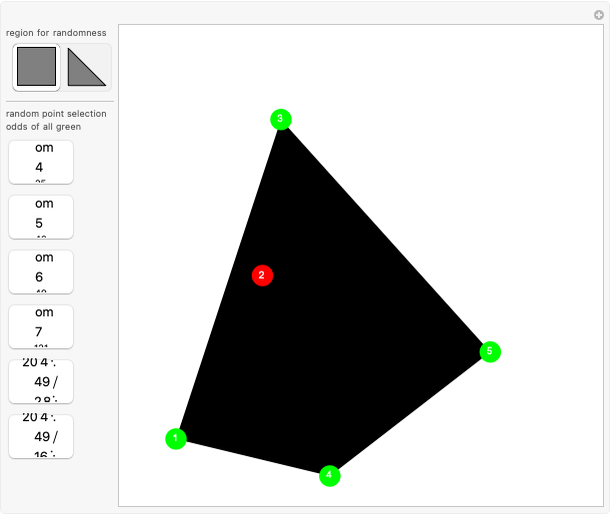 Sylvester's Four-Point Problem
Ed Pegg Jr -
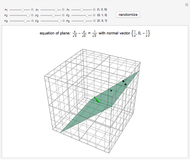 Three Points Determine a Plane
Ed Pegg Jr -
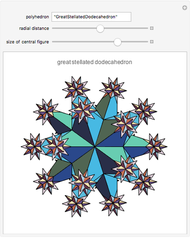 Polyhedra Copied to the Vertices of the Same Kind of Polyhedron
Ed Pegg Jr