P&F Charts

Requires a Wolfram Notebook System
Interact on desktop, mobile and cloud with the free Wolfram Player or other Wolfram Language products.
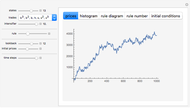
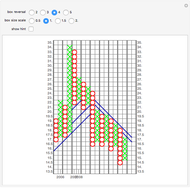
This Demonstration implements point and figure (P&F) charting of stock prices. Before the advent of modern stock charts, P&F charting was a traditional charting technique. It is still very popular today because it is very simple to maintain by hand and reduces a stock chart to its most compact form, making it much easier to search for patterns in price behavior.
[more]
Contributed by: Ed Bukhman (March 2011)
Open content licensed under CC BY-NC-SA
Snapshots
Details
T. J. Dorsey, Point and Figure Charting: The Essential Application for Forecasting and Tracking Market Prices, New York: John Wiley and Sons, 2007.
For more information, see the Wikipedia entry for Point and figure chart.
Permanent Citation
"P&F Charts"
http://demonstrations.wolfram.com/PFCharts/
Wolfram Demonstrations Project
Published: March 7 2011


