Plots of the Fermi-Dirac Distribution


Requires a Wolfram Notebook System
Interact on desktop, mobile and cloud with the free Wolfram Player or other Wolfram Language products.
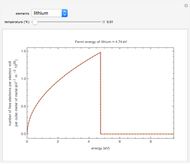
Fermi-Dirac statistics deals with identical and indistinguishable particles with half-integral spins. Electrons, protons, neutrons, and so on are particles (called fermions) that follow Fermi-Dirac statistics. Fermions obey the Pauli exclusion principle, which states that two fermions cannot occupy the same quantum state at the same time. The Fermi-Dirac distribution function gives the probability that a given energy level is occupied by a fermion for a system in thermal equilibrium.
[more]


Contributed by: Kallol Das (St. Aloysius College, Jabalpur, India) (March 2011)
Open content licensed under CC BY-NC-SA
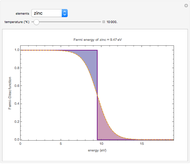
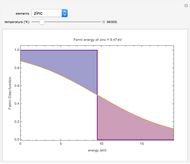
Snapshots


Details
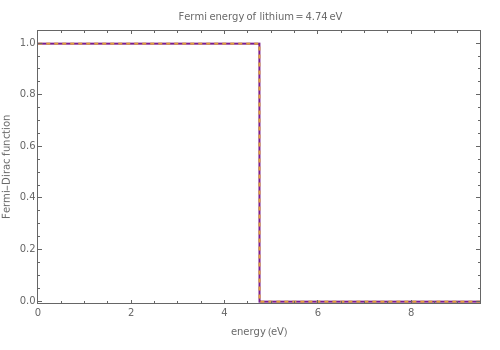
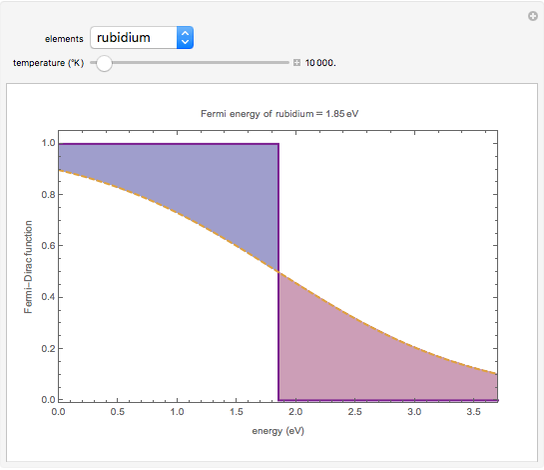
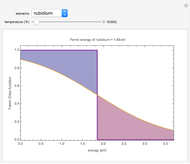
The dashed orange lines are plots of the Fermi-Dirac distribution function as a function of energy. At 0.0 °K, the highest occupied energy level is  .The blue section shows unoccupied energy levels at elevated temperatures, in the neighborhood of .The red section shows occupied energy levels with energies greater than at high temperatures. For comparison, the Fermi function at 0.001 °K is shown with bold purple lines.
The Fermi energy of elements is taken from N. W. Ashcroft and N. D. Mermin, Solid State Physics, New York: Holt, Rinehart and Winston, 1976.
The Fermi-Dirac distribution function details are taken from C. Kittel, Introduction to Solid State Physics, 5th ed., New York: Wiley, 1976.
Additional information on the free electron model can be found on Wikipedia.
Permanent Citation
 Fermi-Dirac Distributions for Free Electrons in Metals
Kallol Das (St. Aloysius College, Jabalpur, India)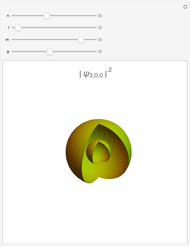 Hydrogen Orbitals
Michael Trott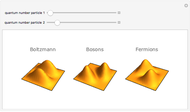 Wave Functions of Identical Particles
Michael Trott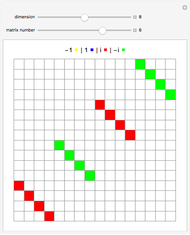 Dirac Matrices in Higher Dimensions
Enrique Zeleny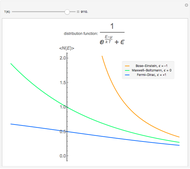 Bose-Einstein, Fermi-Dirac, and Maxwell-Boltzmann Statistics
Christian Freier (University of Technology Berlin) Harmonic Oscillator Eigenfunctions
Michael Trott Rovibronic Infrared Spectrum of a Rigid Diatomic Rotor
Whitney R. Hess and Lisa M. Goss (Idaho State University) Quantized Solutions of the 1D Schrödinger Equation for a Harmonic Oscillator
Jamie Williams The Hydrogen Atom in Parabolic Coordinates
S. M. Blinder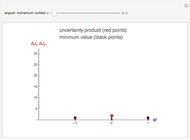 Uncertainty Product for Angular Momentum Components
Reinhard Tiebel
-
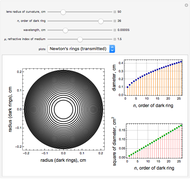 Reflected and Transmitted Newton's Rings
Kallol Das -
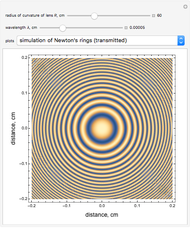 Intensity Profiles for Newton's Rings
Kallol Das -
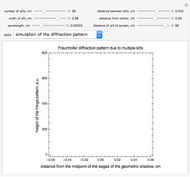 Fraunhofer Diffraction at Multiple Slits
Kallol Das -
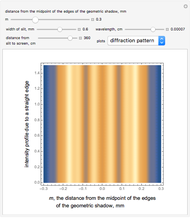 Fresnel Diffraction at a Single Slit
Kallol Das -
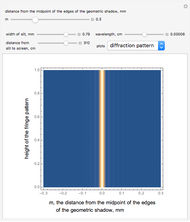 Fraunhofer Diffraction at a Single Slit
Kallol Das -
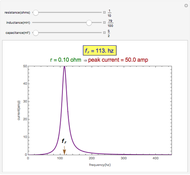 Frequency Response of an LCR Circuit
Kallol Das -
 Heat Capacity of Solids in the Debye Approximation
Kallol Das -
 Plots of the Fermi-Dirac Distribution
Kallol Das -
Fermi-Dirac Distributions for Free Electrons in Metals
Kallol Das