Price Competition

Requires a Wolfram Notebook System
Interact on desktop, mobile and cloud with the free Wolfram Player or other Wolfram Language products.
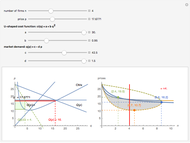
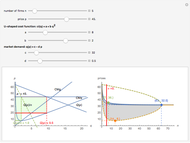
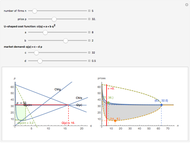
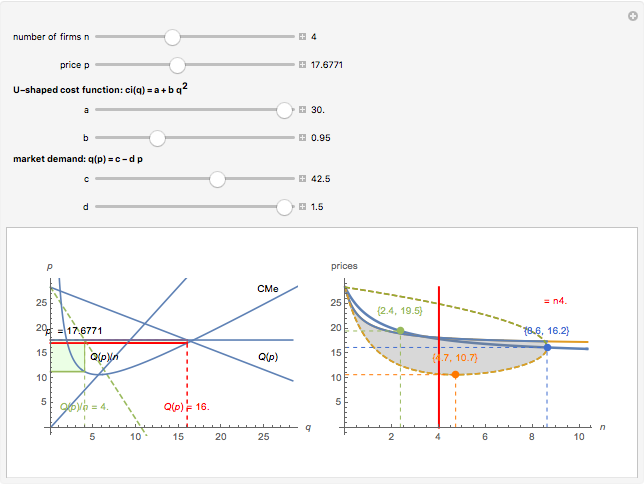
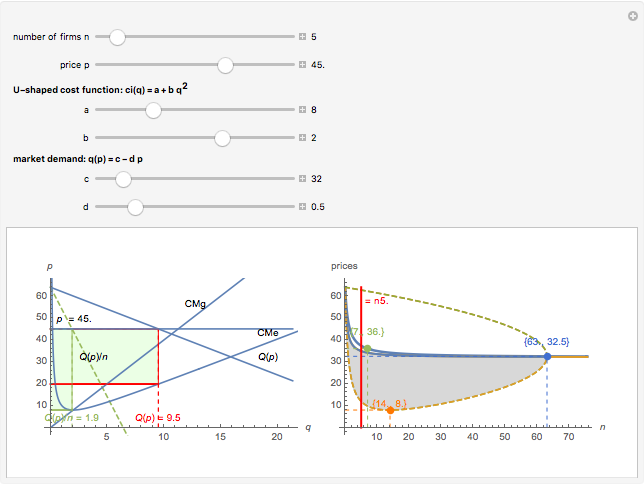
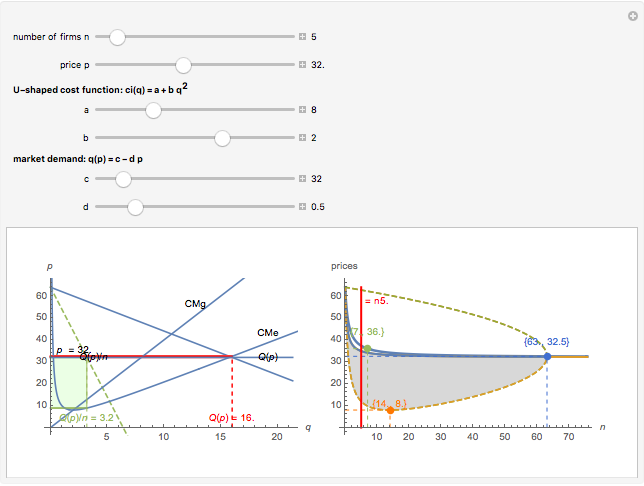
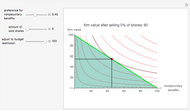
We show equilibrium prices when firms compete on the basis of price (Bertrand), but with a U-shaped average cost function. The graph on the left shows total market demand, one firm's demand function (the total demand at price  , denoted
  , divided by
  ), one firm's cost function, and the average and marginal cost function. The graph on the left also shows, for each price , the profit level when the firm covers all or only a fraction,
  , of the market demand. When profit covering all the demand is lower than profit covering only the
  part of the demand, is an equilibrium price (i.e., there are no incentives to slightly lower the price). On the right, you can see how equilibrium prices (the shadowed area) change as a function of the number of firms in the industry.
Contributed by: Loreto Llorente (February 2009)
Open content licensed under CC BY-NC-SA
Snapshots
Details
Permanent Citation
 Profit Maximization in Perfect Competition
Fiona Maclachlan Plotting Price Divergences
Ed Bukhman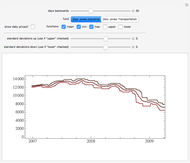 Stock Price Envelopes
Seth J. Chandler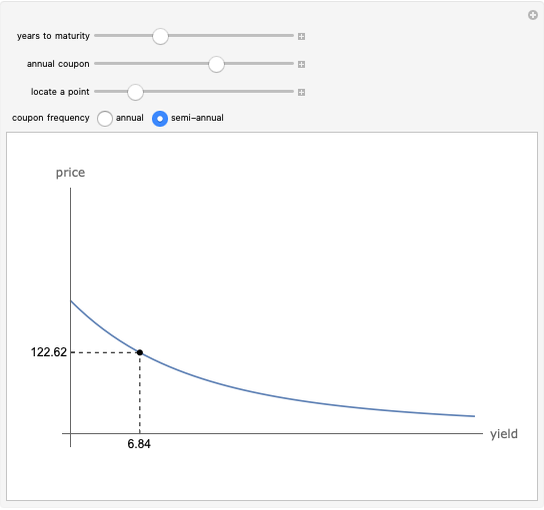 Price-Yield Curve
Fiona Maclachlan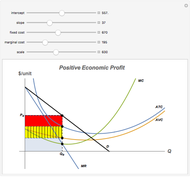 Cost and Revenue for Monopoly and Monopolistic Competition
Craig Marcott The Price-Terms Tradeoff
Roger J. Brown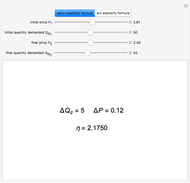 The Price Elasticity of Demand
Sarah Lichtblau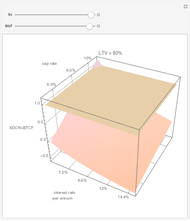 Explaining Real Estate Price Bubbles
Roger J. Brown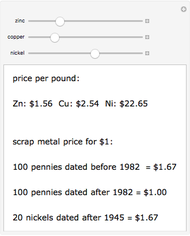 Scrap Metal Price of Coins
Ed Pegg Jr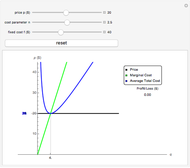 Competitive Model
David Youngberg
-
 Price Competition
Loreto Llorente -
 Principal Becomes an Agent
Loreto Llorente -
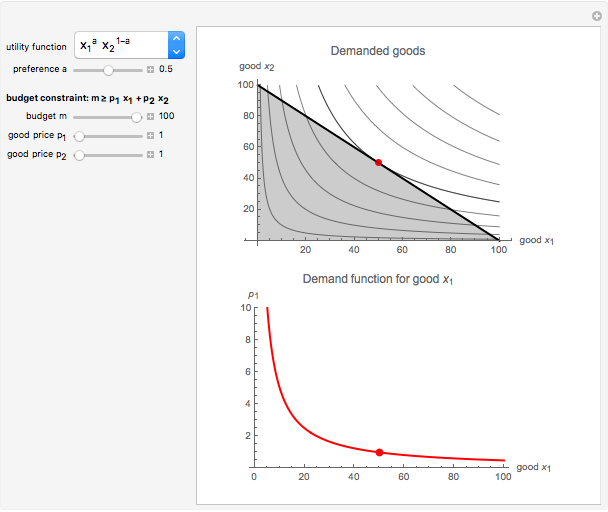 Consumer Demand
Loreto Llorente -
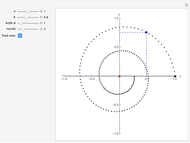 Logarithmic Spiral
Loreto Llorente -
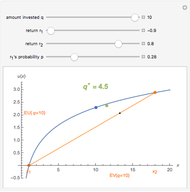 Expected Utility: Optimal Asset Investment
Loreto Llorente -
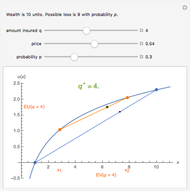 Expected Utility: Optimal Insurance
Loreto Llorente -
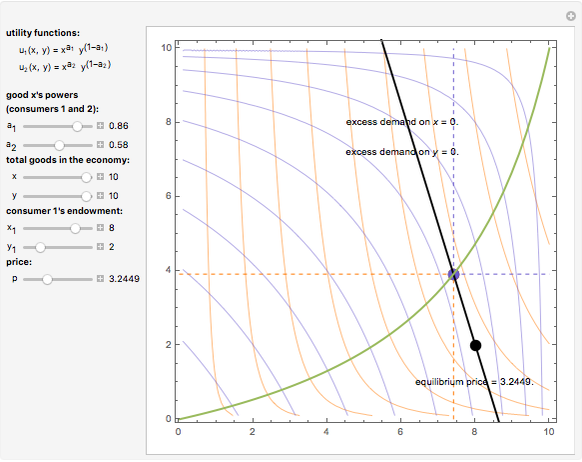 Walrasian Equilibrium or Disequilibrium
Loreto Llorente