Expected Utility: Optimal Asset Investment


Requires a Wolfram Notebook System
Interact on desktop, mobile and cloud with the free Wolfram Player or other Wolfram Language products.
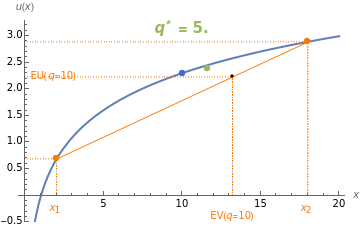
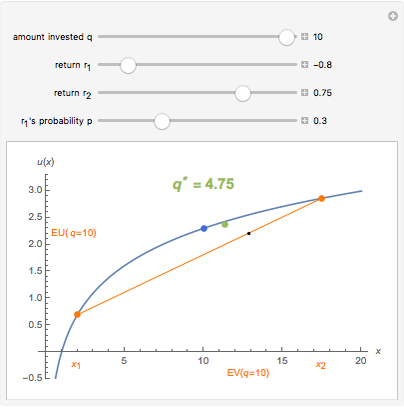
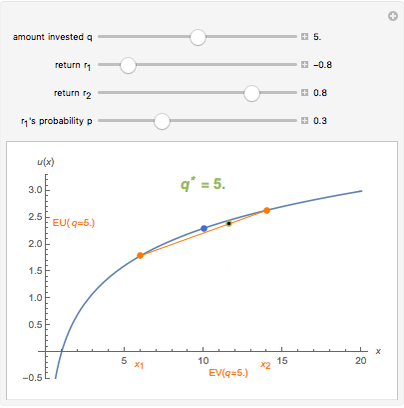
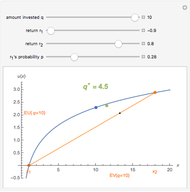
An investor begins with 10 units of wealth that can be invested in a risky asset, or maintained as cash with no return. Assume the risky asset yields a rate of return of  or
or  with probabilities
  and
and  , respectively, and let
  be the number of units of wealth that the investor decides to invest in the asset. The value of the investor's portfolio at the end of the period will be
  . Let the two possible end-of-period values of the portfolio be
  and
and  , shown above along the horizontal axis. The Bernoulli logarithmic utility function of wealth (constant relative risk aversion, CRRA) is plotted in blue. The orange line is a plot of the expected value and the corresponding expected utility of the portfolio for different values of
  . The optimal portfolio is the one for which the expected utility is a maximum, as shown by the green dot.
Contributed by: Loreto Llorente (March 2011)
Open content licensed under CC BY-NC-SA
Snapshots

Details
detailSectionParagraphPermanent Citation
"Expected Utility: Optimal Asset Investment"
http://demonstrations.wolfram.com/ExpectedUtilityOptimalAssetInvestment/
Wolfram Demonstrations Project
Published: March 7 2011
 Expected Utility: Optimal Insurance
Loreto Llorente Investment Leverage Effect
Michael Schreiber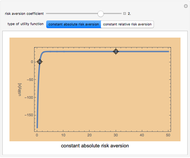 Constant Risk Aversion Utility Functions
Seth J. Chandler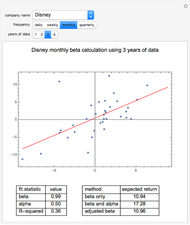 Expected Returns of the Dow Industrials, Beta Model
Jeff Hamrick and Jason Cawley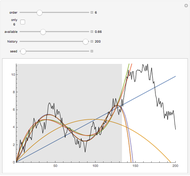 Polynomial Fits of Random Walks
Michael Schreiber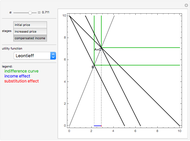 Income and Substitution Effects with Different Utility Functions
Massimiliano Landi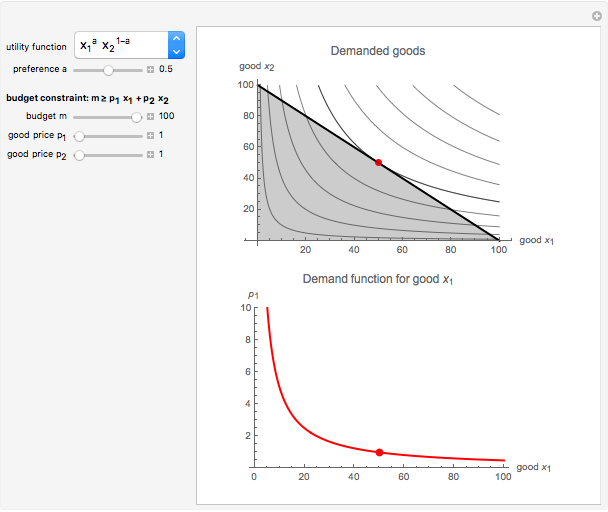 Consumer Demand
Loreto Llorente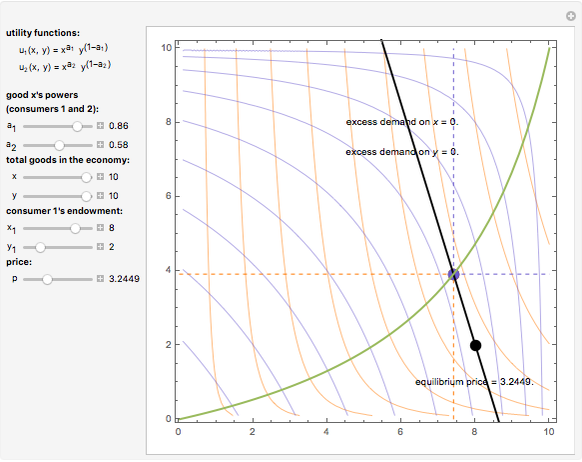 Walrasian Equilibrium or Disequilibrium
Loreto Llorente How Much Should I Reinvest in a Business?
Lucas Tsui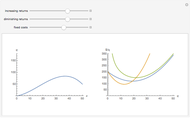 Short-Run Production and Cost Curves
Tom Creahan
-
 Price Competition
Loreto Llorente -
 Principal Becomes an Agent
Loreto Llorente -
Consumer Demand
Loreto Llorente -
 Logarithmic Spiral
Loreto Llorente -
 Expected Utility: Optimal Asset Investment
Loreto Llorente -
Expected Utility: Optimal Insurance
Loreto Llorente -
Walrasian Equilibrium or Disequilibrium
Loreto Llorente