Relationship between the Tone Curve and the Histogram of a Photographic Image

Requires a Wolfram Notebook System
Interact on desktop, mobile and cloud with the free Wolfram Player or other Wolfram Language products.
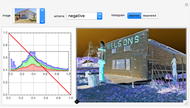
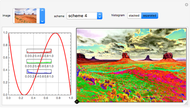
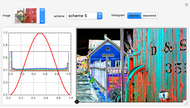
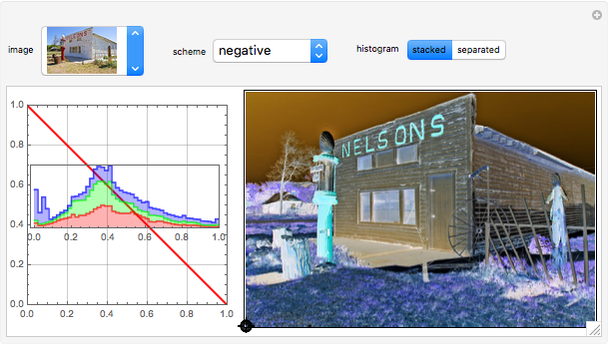
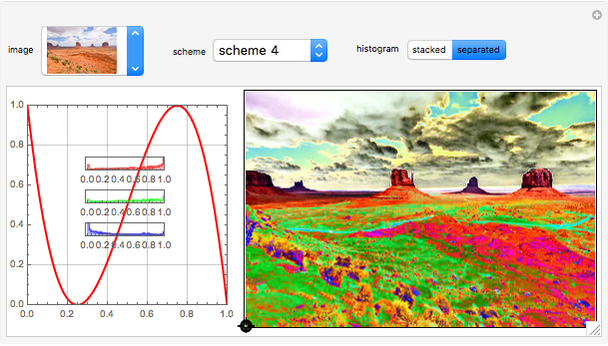
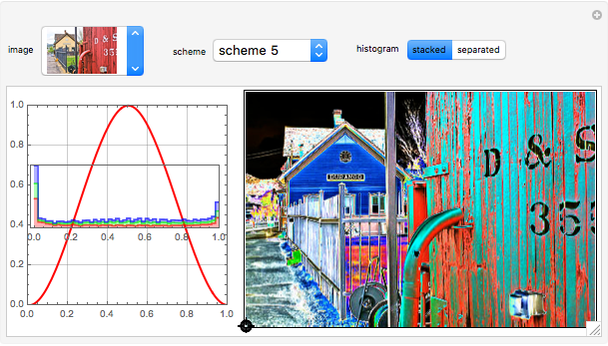
This Demonstration shows the effect of tone curve adjustments on a photographic image and its histogram. The tone curve defines the brightness relationship between the input (original) values (on the  axis) and output (result) values (on the
  axis).The histogram displays the tonal distribution of the image. It displays level of brightness on the
  axis from dark to light. The
  axis represents the total number of pixels in the image with that level of brightness. Adjust the tone curve by dragging any of the five locators or choosing one of the preset schemes.
Contributed by: Erik Mahieu (March 2011)
Open content licensed under CC BY-NC-SA
Snapshots
Details
detailSectionParagraph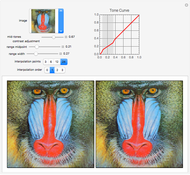 Mid-tone Contrast Enhancement of Photographic Images
Erik Mahieu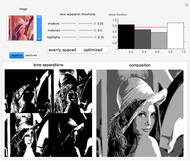 Optimizing Tone Separation of Photographic Images
Erik Mahieu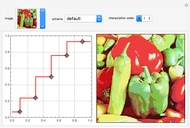 Tone Curve
Erik Mahieu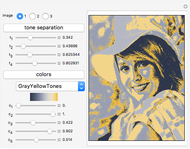 Posterization of Grayscale Images
Erik Mahieu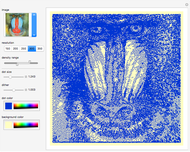 Stippling Effect for Photographic Images
Erik Mahieu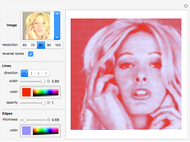 Line Halftones of Photographic Images
Erik Mahieu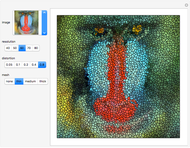 Mosaic Effect for Photographic Images
Erik Mahieu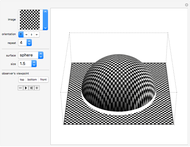 Perspective Anamorphosis of Photographic Images
Erik Mahieu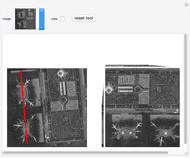 Straightening Tool for Photographic Images
Erik Mahieu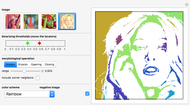 Creating Posters from Photographic Images
Erik Mahieu
-
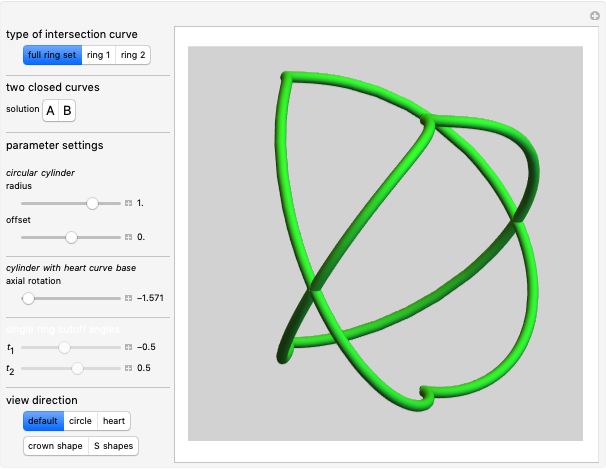 4. Ambiguous Rings Based on a Heart Curve
Erik Mahieu -
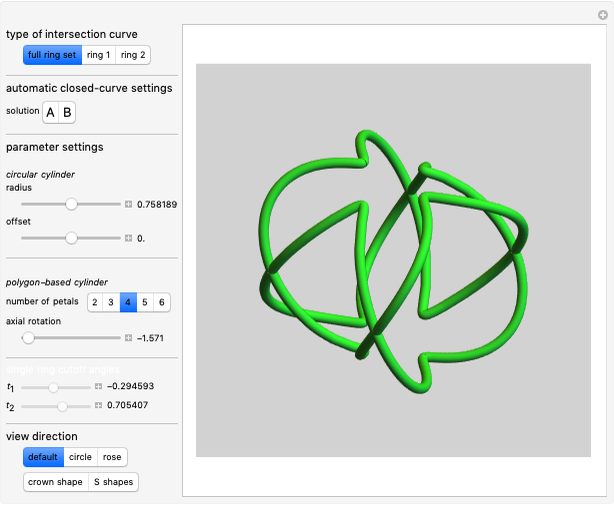 3. Ambiguous Rings Based on a Rose Curve
Erik Mahieu -
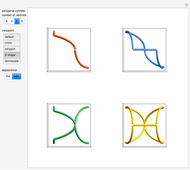
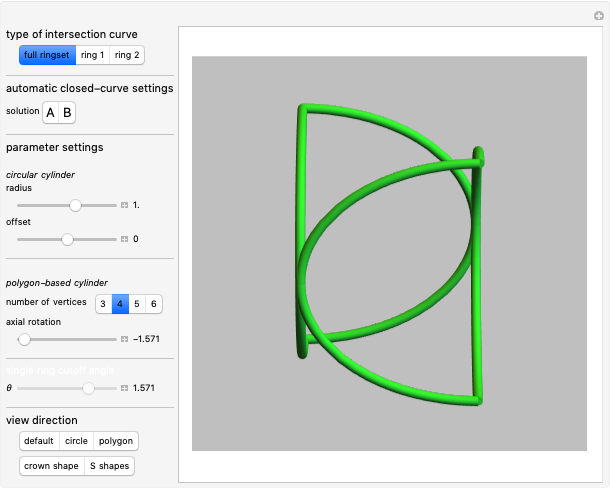 2. Ambiguous Rings Based on a Polygon
Erik Mahieu -
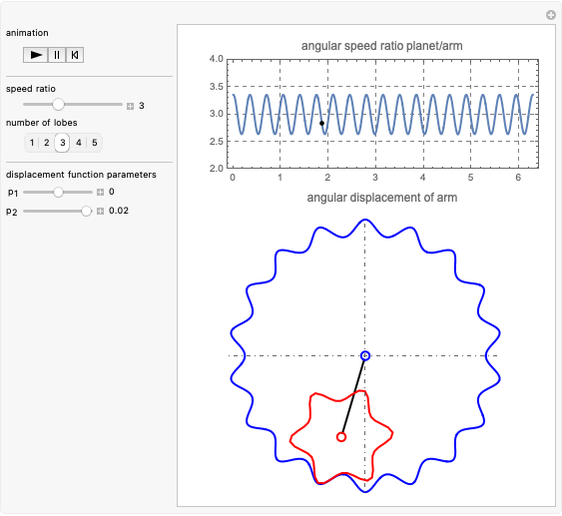 Noncircular Planetary Drive
Erik Mahieu -
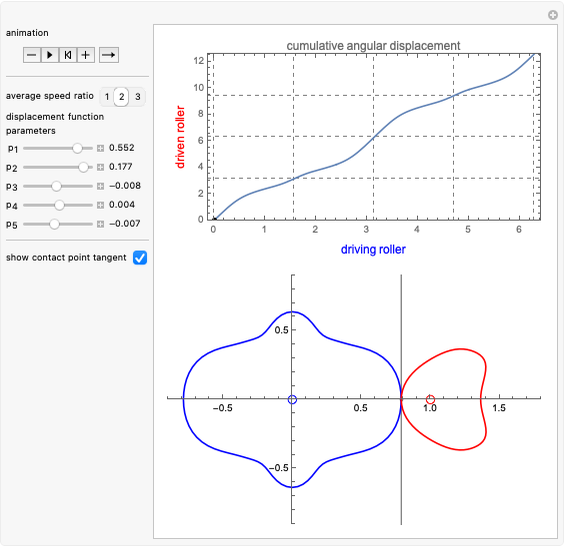 Noncircular Roller Drive
Erik Mahieu -
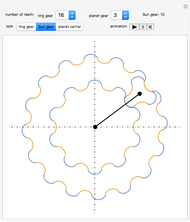 Planetary Gear Train
Erik Mahieu -
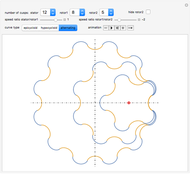 Rolling Cycloidal Curves
Erik Mahieu -
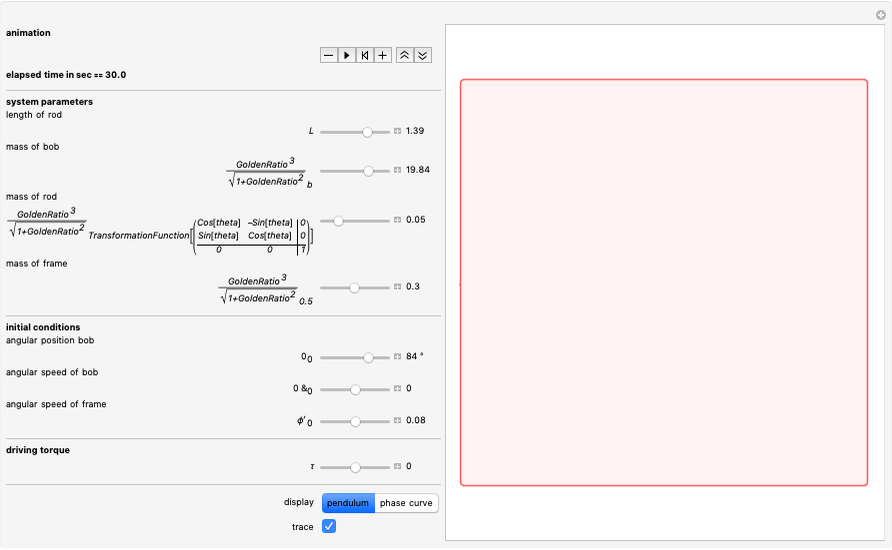 Driven Spherical Pendulum
Erik Mahieu -
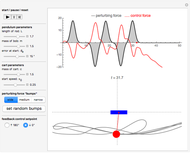 Automatic Feedback Control of a Pendulum-and-Cart System
Erik Mahieu -
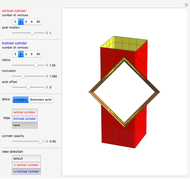
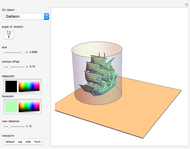
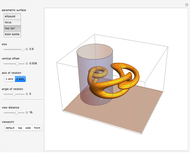
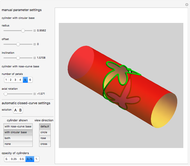 Intersection of a Generalized Cylinder over a Rose Curve with a Circular Cylinder
Erik Mahieu -
 1. Ambiguous Rings
Erik Mahieu -
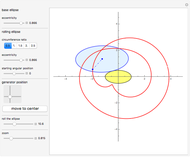 Elliptic Epitrochoid
Erik Mahieu -
 Intersection of Two Polygonal Cylinders
Erik Mahieu -
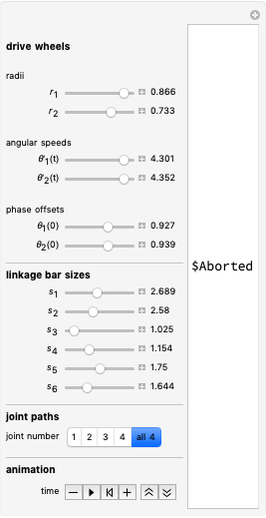 Designs from Mechanical Linkages
Erik Mahieu -
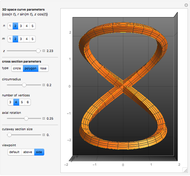 3D Extrusion Using the Frenet-Serret System
Erik Mahieu -
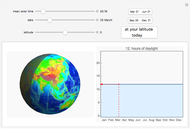 Daylight Calculator
Erik Mahieu -
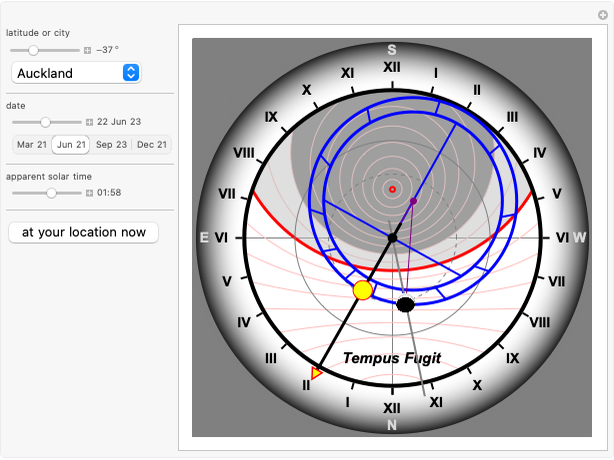 Astronomical Clock
Erik Mahieu -
 Cylindrical Anamorphosis of 3D Polygonal Meshes
Erik Mahieu -
 Cylindrical Anamorphosis of Parametric Surfaces
Erik Mahieu -
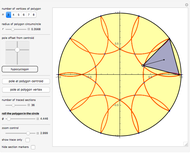 Roulette (Hypotrochogon) of a Polygon Rolling inside a Circle
Erik Mahieu