Simulating a Normal Process from Sums of Uniform Distributions


Requires a Wolfram Notebook System
Interact on desktop, mobile and cloud with the free Wolfram Player or other Wolfram Language products.
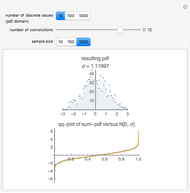
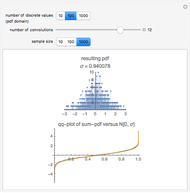
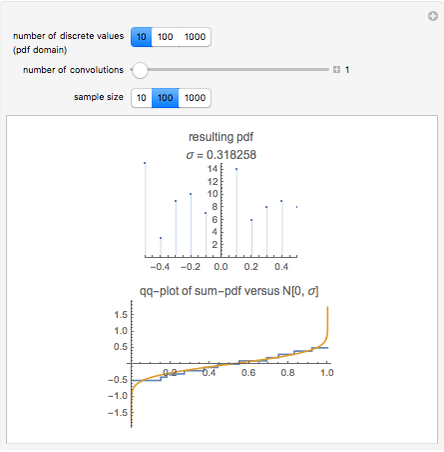
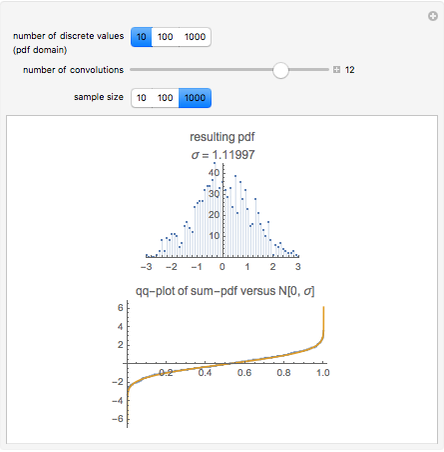
A convenient simulation of a random normal process comes from a sum of random uniform variables. The probability density function (pdf) of sums of random variables is the convolution of their pdfs. Sums of uniform random variables can be seen to approach a Gaussian distribution.
[more]
Contributed by: Jim Gerdy (March 2011)
Open content licensed under CC BY-NC-SA
Snapshots


Details
Apart from the parameter for the number of uniform distributions to be summed (the slider), you can control the discretization of the distribution and the sample size of the simulation. The uniform distribution is discrete in all cases in this simulation on a grid with  points for a few choices of
  . The sample size varies between 10 and 5000 points.
The statistics of distributions that are the sums of elementary distributions is detailed in most statistics textbooks. For example:
A. M. Mood, F. A. Graybill, and D. C. Boes, Introduction to the Theory of Statistics, New York: McGraw-Hill, 1974.
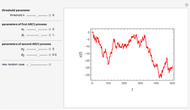 Two-Regime Threshold Autoregressive Model Simulation
Jozef Barunik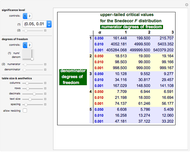 Upper-Tailed Critical Values of the Fisher-Snedecor Distribution
Jim R Larkin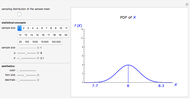 Sampling Distribution of the Sample Mean
Jim R Larkin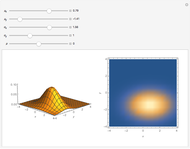 The Bivariate Normal Distribution
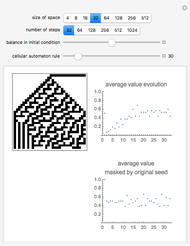
Chris Boucher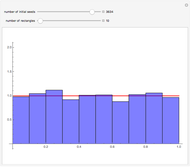 Comparing Rule 30 Pseudorandoms to a Uniform Distribution
Chris Boucher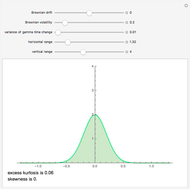 The Return Distribution of the Variance Gamma Process
Andrzej Kozlowski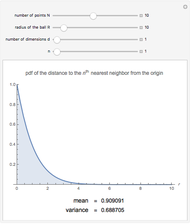 Distance Distributions in Finite Uniformly Random Point Processes
Sunil Srinivasa and Martin Haenggi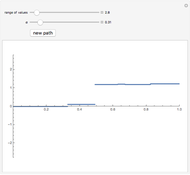 Stable Lévy Process
Andrzej Kozlowski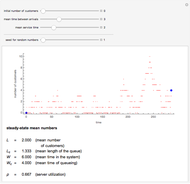 Simulating the M/M/1 Queue
Heikki Ruskeepää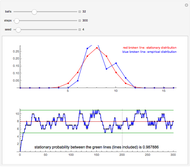 Simulating the Bernoulli-Laplace Model of Diffusion
Heikki Ruskeepää
-
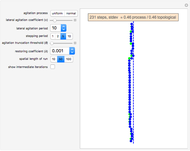 Exploration of Fluid Meandering by Statistical Simulation
Jim Gerdy -
 Cumulative Cooling and Heating Degree Days
Jim Gerdy -
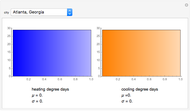 Histograms of Heating and Cooling Degree Days
Jim Gerdy -
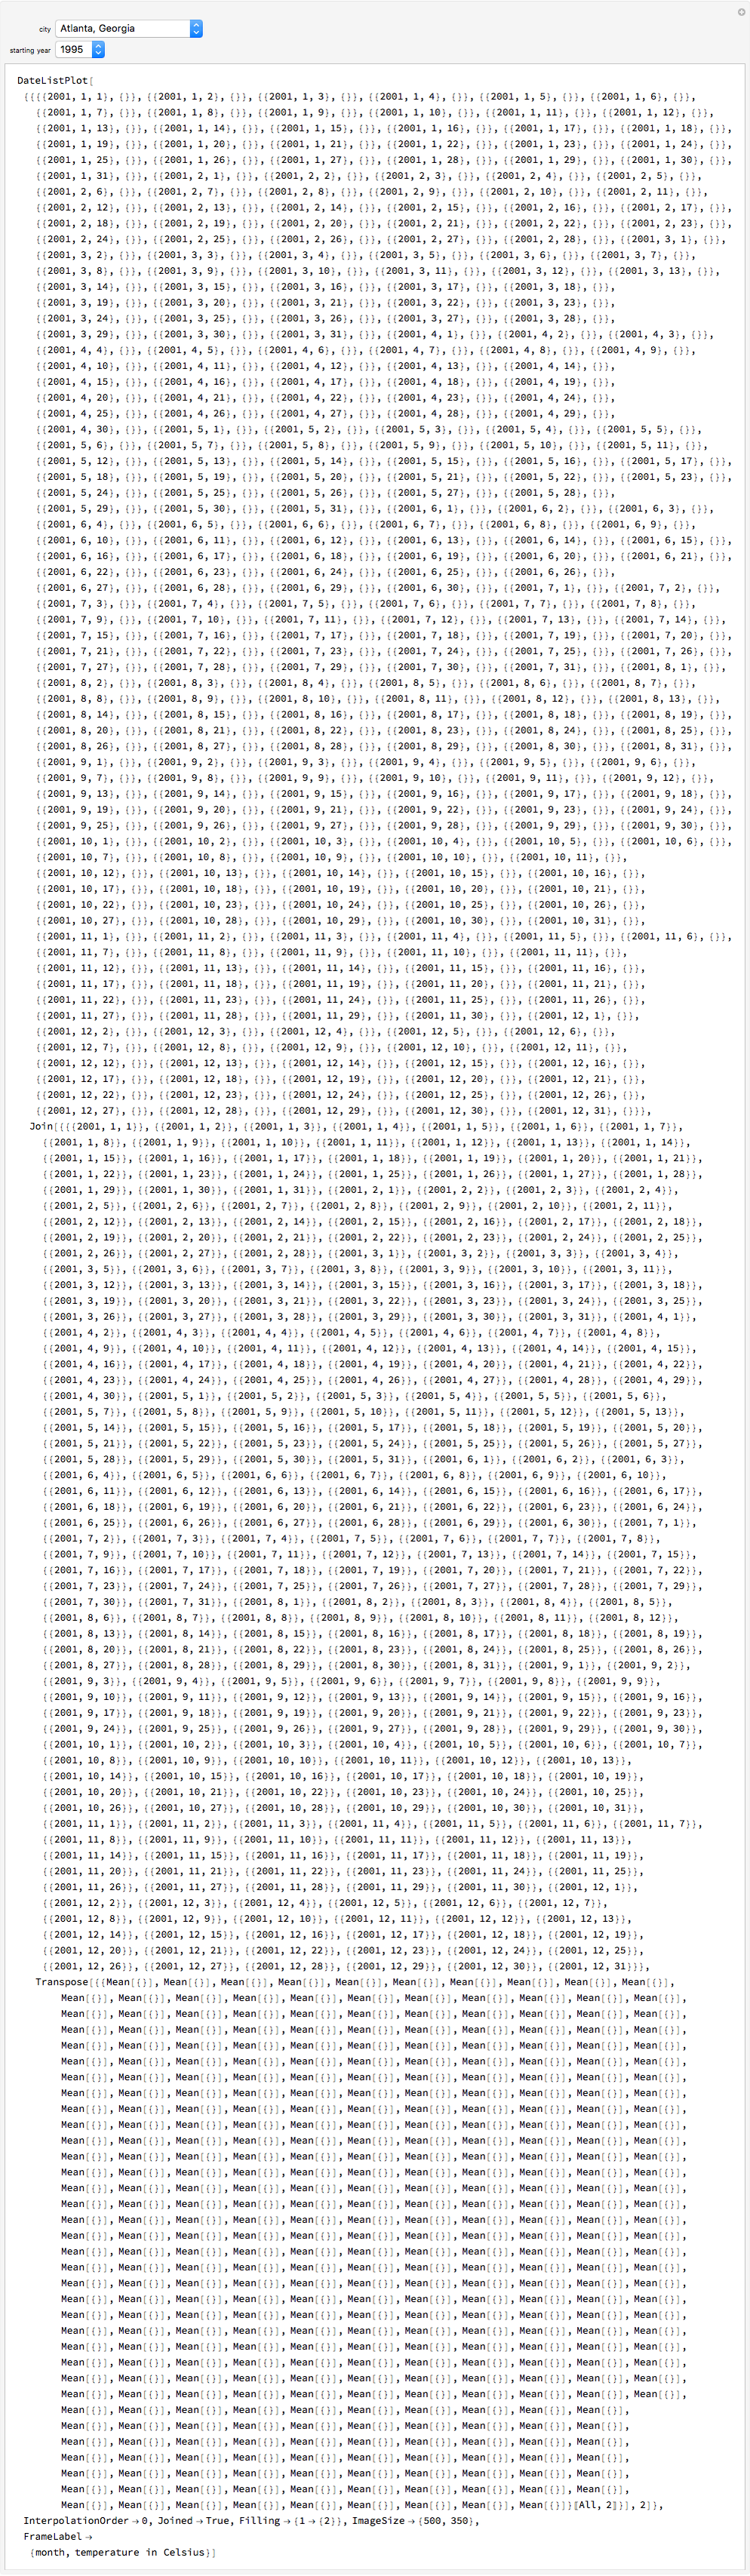 Annual Temperature Cycles
Jim Gerdy -
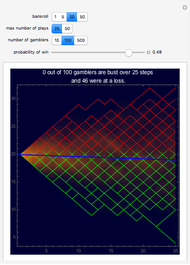 House Profits in Negative Edge Games
Jim Gerdy -
 Factorial Number Base
Jim Gerdy -
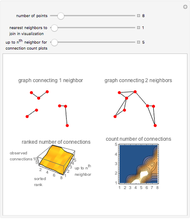 Nearest Neighbor Graph Connections
Jim Gerdy -
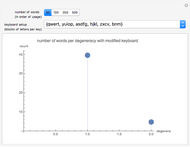 Efficacy of Degenerate Keyboard Maps
Jim Gerdy -
 Simulating a Normal Process from Sums of Uniform Distributions
Jim Gerdy -
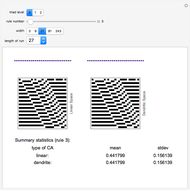 Cellular Automaton Rules on Dendrites
Jim Gerdy -
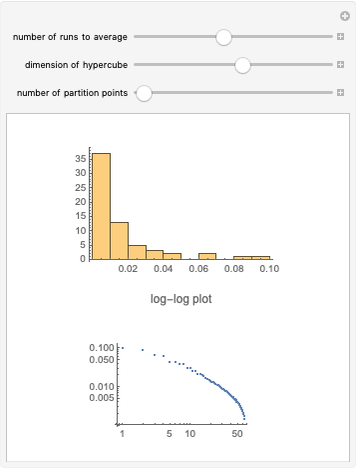 The Broken Stick in n Dimensions
Jim Gerdy -
 Cellular Automaton Browser
Jim Gerdy -
 Random Partitioning of a List
Jim Gerdy