Baseball: Graph of On-Base Percentage


Requires a Wolfram Notebook System
Interact on desktop, mobile and cloud with the free Wolfram Player or other Wolfram Language products.
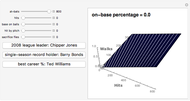
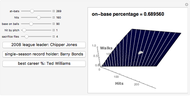
This Demonstration is a graphical representation of the On-Base Percentage (OBP) statistic, which is widely used in baseball. OBP is based on (1) the at-bats a player has had; (2) the number of successful hits in these at-bats; (3) the player's walks; (4) the number of times the player has been hit by a pitch; and (5) the number of sacrifice flies the player has hit. In baseball, the walks, hit by pitches, and sacrifice flies are not counted as official at-bats, and so these stats must be separately accounted for in the OBP formula. Because sacrifice flies and hit by pitches are so rare (and therefore have a small influence on the graph), the axes of the graph use hits and walks, which are much more abundant. This Demonstration calculates and gives a visual representation of any OBP. Using examples, it can help in obtaining a better understanding of one of the most popular statistics in the game of baseball.
Contributed by: Danny Strockis (March 2011)
Open content licensed under CC BY-NC-SA
Snapshots


Details
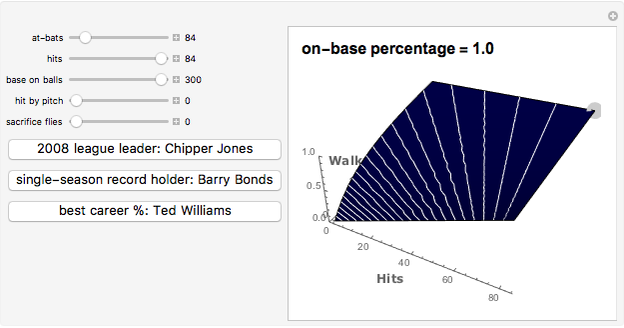
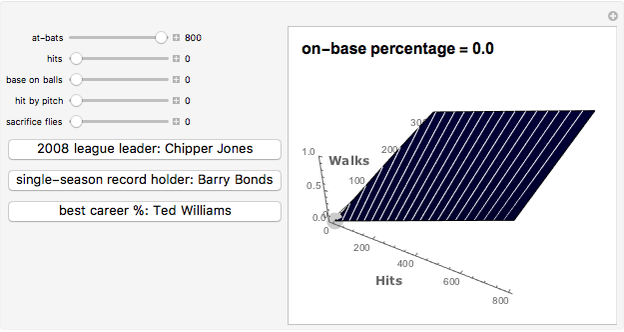
Because OBP is a percentage, it is possible for someone with 800 at-bats to have the same value as someone with only 10 at-bats. To compensate, the graph changes its shape as the number of at-bats changes. This idea can be seen in Snapshot 3, where the gray indicator can move along the graph as expected, but it can also be raised by altering the at-bats, changing the shape of the graph, and changing the OBP value. All historical statistics were obtained from www.baseballreference.com
Permanent Citation
"Baseball: Graph of On-Base Percentage"
http://demonstrations.wolfram.com/BaseballGraphOfOnBasePercentage/
Wolfram Demonstrations Project
Published: March 7 2011
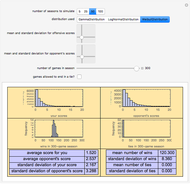 Sports Seasons Based on Score Distributions
Seth J. Chandler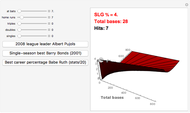 Baseball: Graph of Slugging Percentage
Danny Strockis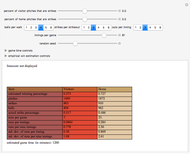 Baseball without Swings
Seth J. Chandler Basis Instruments Contracts (BICs) in Baseball World Series Odds
Phil Kongtcheu Rock, Paper, Scissors with AI Player
Jon McLoone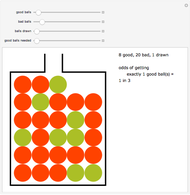 Urn Problem
Ed Pegg Jr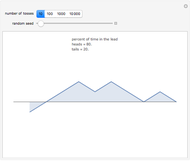 Leads in Coin Tossing
Fiona Maclachlan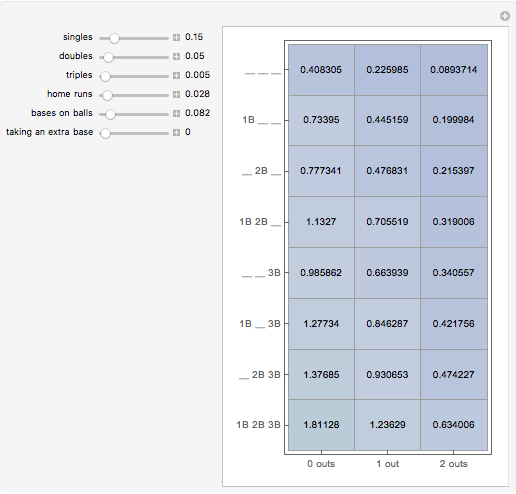 Run Expectancy Matrix in Baseball
Ben Dilday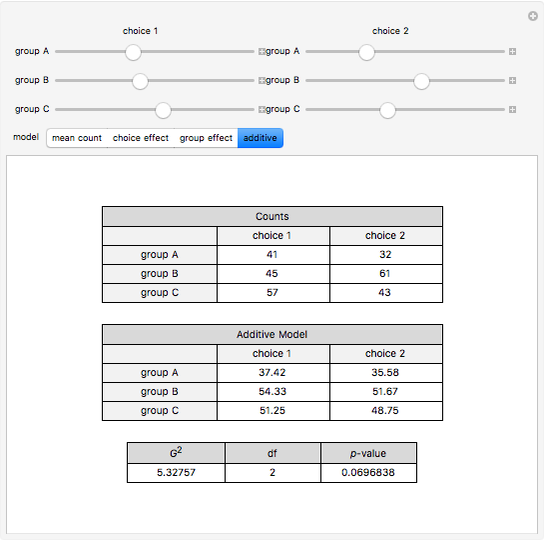 Likelihood-Based Goodness of Fit in Two-Way Contingency Tables
Darren Glosemeyer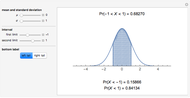 Finding Probabilities for Intervals of a Normal Distribution
Juan D. Montoro-Pons
