Baseball: Graph of Slugging Percentage

Requires a Wolfram Notebook System
Interact on desktop, mobile and cloud with the free Wolfram Player or other Wolfram Language products.
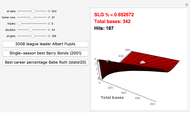
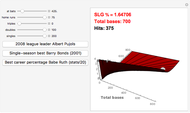
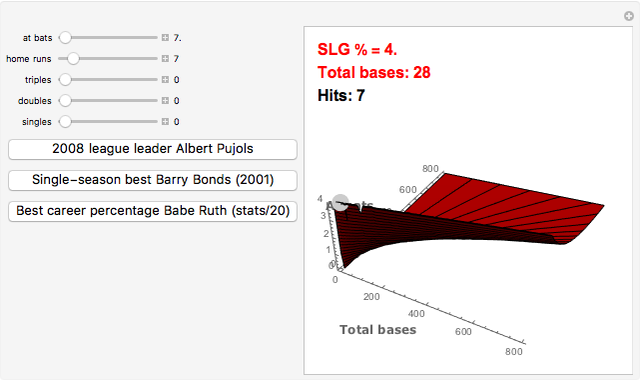
This is a graphical representation of slugging percentage (SLG), a very popular statistic in baseball. Slugging percentage is determined by calculating the number of total bases and dividing that number by the number of official at bats. Total bases are determined by giving four bases for a home run, three for a triple, two for a double, and one for a single. This graph allows you to manipulate each of these different types of hits, and the Demonstration calculates the slugging percentage accordingly. However, the graph itself uses total bases and at bats as the axes, creating a smooth graph that can effectively show the trends of this interesting statistic.
Contributed by: Danny Strockis (March 2011)
Open content licensed under CC BY-NC-SA
Snapshots


Details
All statistics were acquired from Baseball-Reference.com.
Permanent Citation
"Baseball: Graph of Slugging Percentage"
http://demonstrations.wolfram.com/BaseballGraphOfSluggingPercentage/
Wolfram Demonstrations Project
Published: March 7 2011
 Baseball: Graph of On-Base Percentage
Danny Strockis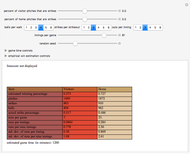 Baseball without Swings
Seth J. Chandler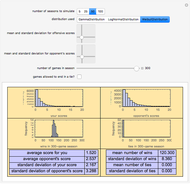 Sports Seasons Based on Score Distributions
Seth J. Chandler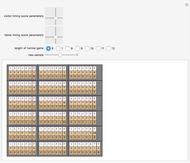 Generating Realistic Baseball Line Scores
Seth J. Chandler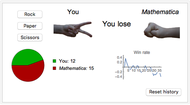 Rock, Paper, Scissors with AI Player
Jon McLoone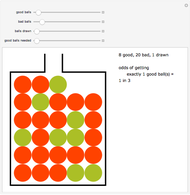 Urn Problem
Ed Pegg Jr NFL Quarterback Passer Rating
Abby Brown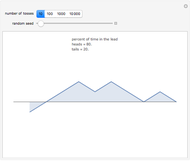 Leads in Coin Tossing
Fiona Maclachlan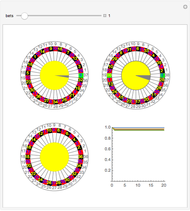 Expectations for Roulette
Michael Schreiber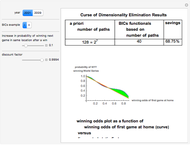 Basis Instruments Contracts (BICs) in Baseball World Series Odds
Phil Kongtcheu
