Ecosystem Dynamics


Requires a Wolfram Notebook System
Interact on desktop, mobile and cloud with the free Wolfram Player or other Wolfram Language products.
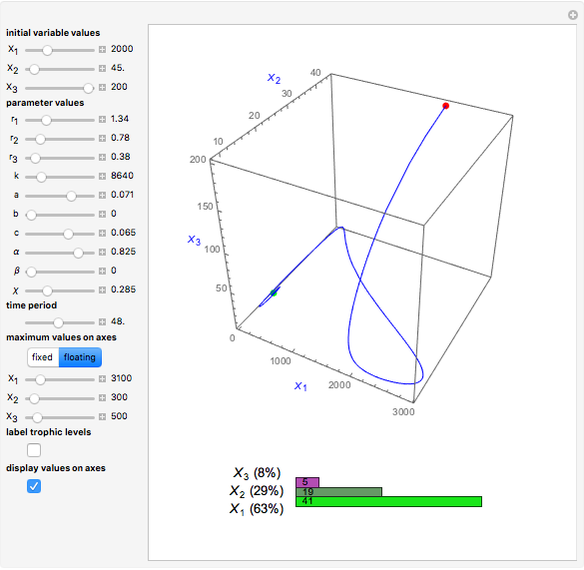
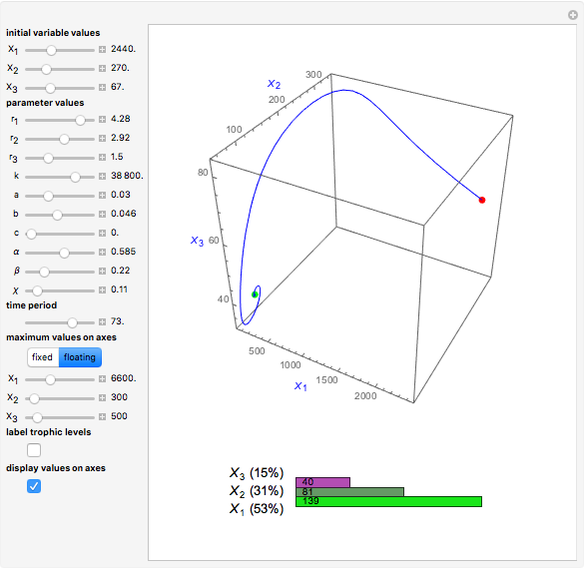
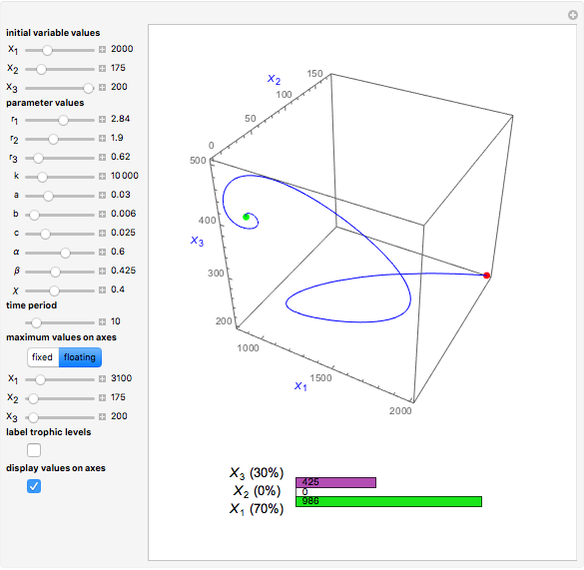
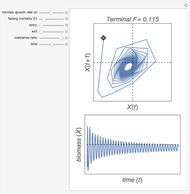
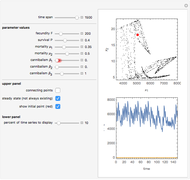
Consider an ecosystem consisting of three trophic levels, 1 being the lowest and 3 the top predator level. Let the system be described by a set of differential equations, each representing the biomass dynamics of one of the three levels. The model is within the basic framework introduced by May and co-workers [1];  represents biomasses of the
  trophic level.


Contributed by: Arne Eide (March 2011)
Open content licensed under CC BY-NC-SA
Snapshots


Details
[1] R. May, J. R. Beddington, C. W. Clark, S. J. Holt, and R. M. Laws, "Management of Multispecies Fisheries," Science, 205, 1979 pp. 267–277.
Permanent Citation
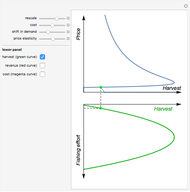
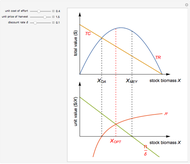
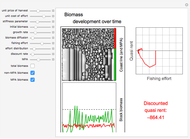
 Quasi-Rent in Open Access Fisheries
Arne Eide Ecosystems with Ghost Invasive Species
Wilfried Gabriel and Maria Stockenreiter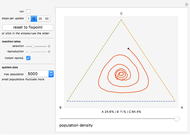 Stochastic Rock-Paper-Scissors Population Dynamics
Martin Weidl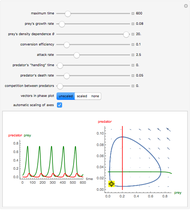 Predator-Prey Dynamics with Type-Two Functional Response
Wilfried Gabriel Lotka-Volterra Discrete Difference Equations
Conrad A. Benulis Simple Dynamics of Epidemics, the Reproduction Number
Clay Gruesbeck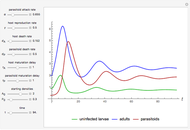 Modeling Parasitoid-Host Dynamics with Delay Differential Equations
Ferdinand Pfab Dynamical Behavior of a Duffing Oscillator
Satya Mohapatra Dynamic Behavior of a Simple Canonical System
Housam Binous Motion of an n-Point Dynamical System
Faisal Mohamed
-
 Fishing with Long Line or Gill Net?
Arne Eide -
 Faustmann's Rule of Optimal Rotation
Arne Eide -
 Intramarginal Rent
Arne Eide -
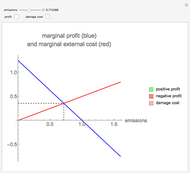 The Economics of Emissions of a Flow Pollutant
Arne Eide -
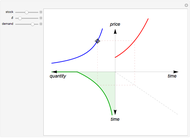
 Curry Triangle Paradox
Arne Eide -
 The Backward-Bending Supply Function in Fisheries
Arne Eide -
 Optimal Queue of Cars
Arne Eide -
 Offspring of Adam and Eve
Arne Eide -
 Bioeconomics of a Discrete Ricker Model with Delayed Recruitment
Arne Eide -
 Maximizing the Present Value of Resource Rent in a Gordon-Schaefer Model
Arne Eide -
 Guitar Chord Maker
Arne Eide -
 Ecosystem Dynamics
Arne Eide -
 Word Memory Game
Arne Eide -
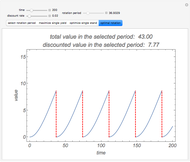
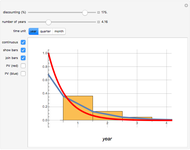 Continuous and Discrete Time Discounting
Arne Eide -
 A Nonlinear Stage-Structured Cannibalism Model
Arne Eide -
 Origami Bases
Arne Eide -
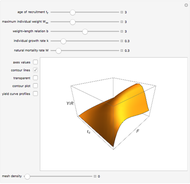 Beverton and Holt's Yield per Recruit Model
Arne Eide -
 Non-Renewable Resource Economics
Arne Eide -
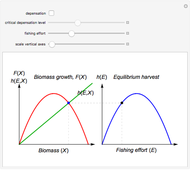 Surplus Production Models and Equilibrium Harvest
Arne Eide -
 Cellular Automata Model of an MPA Fishery
Arne Eide