Plot, Log Plot, and Beyond


Requires a Wolfram Notebook System
Interact on desktop, mobile and cloud with the free Wolfram Player or other Wolfram Language products.
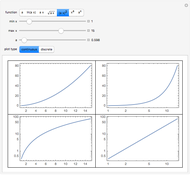
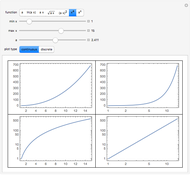
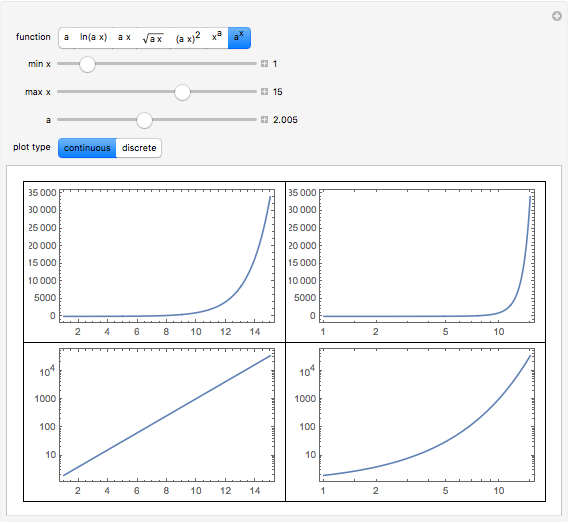
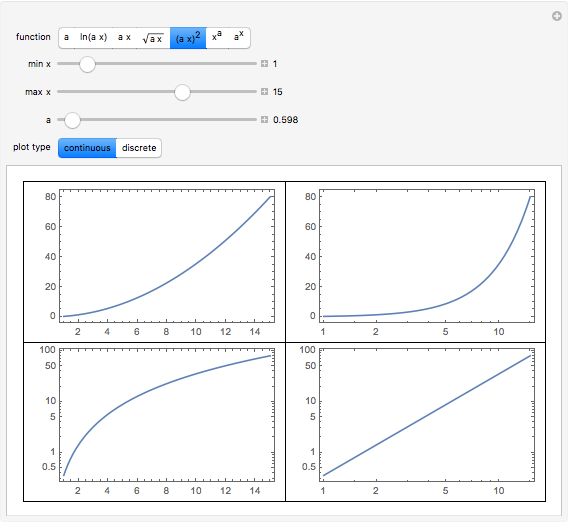
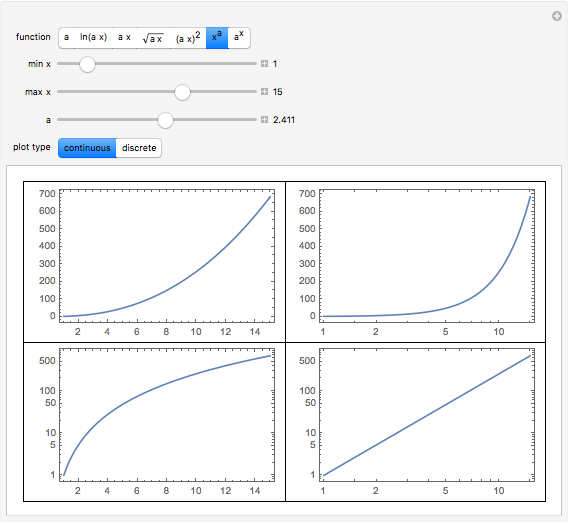
Mathematica can plot data in a variety of ways. Eight different plot types are demonstrated here. For some functions, such as  a log plot is more meaningful than a plot. Hover over a plot to see its Mathematica name.
Contributed by: Ed Pegg Jr (March 2011)
Open content licensed under CC BY-NC-SA
Snapshots

Details
detailSectionParagraphPermanent Citation
"Plot, Log Plot, and Beyond"
http://demonstrations.wolfram.com/PlotLogPlotAndBeyond/
Wolfram Demonstrations Project
Published: March 7 2011
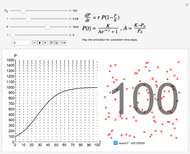 Logistic Model for Population Growth
Abby Brown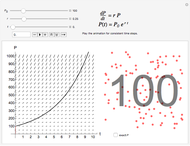 Exponential Model for Population Growth
Abby Brown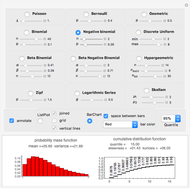 Illustrating the Use of Discrete Distributions
Nasser M. Abbasi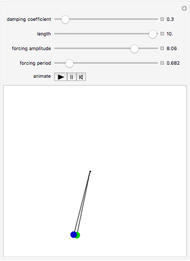 Forced Pendulums with Damping
Rob Morris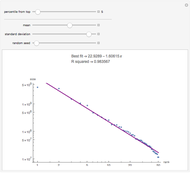 Power Law Tails in Log Normal Data
Fiona Maclachlan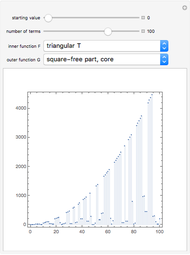 Discrete Number Theory Plots
Ed Pegg Jr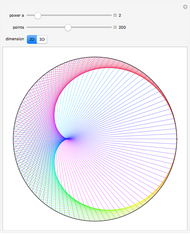 Complex Power Plot
Sue Hurley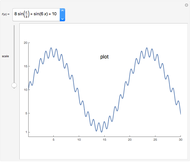 Morphing from Plot to Log Plot
José Luis Gómez-Muñoz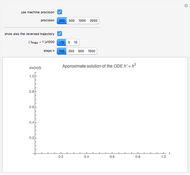 Integrating "Beyond Infinity" and Back
Ulrich Mutze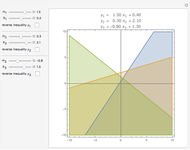 Graph of Inequalities
Ed Pegg Jr
-
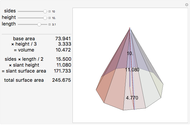 Right Pyramid Volume and Surface Area
Ed Pegg Jr -
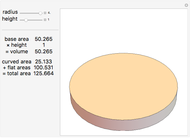
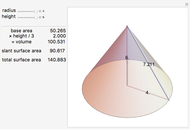 Right Cone Volume and Area
Ed Pegg Jr -
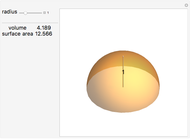 Hemisphere Volume and Surface Area
Ed Pegg Jr -
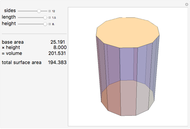
 Cylinder Volume and Area
Ed Pegg Jr -
 Regular Prism Volume and Surface Area
Ed Pegg Jr -
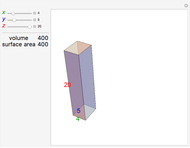 Box Volume and Surface Area
Ed Pegg Jr -
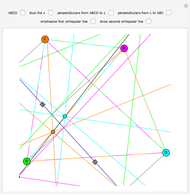 Orthopolar Lines for a Quadrilateral
Ed Pegg Jr -
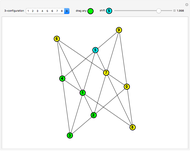 The Nine 10_3 Configurations
Ed Pegg Jr -
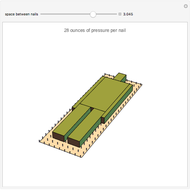 Bed of Nails
Ed Pegg Jr -
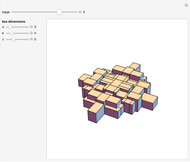 Box Toppling Patterns
Ed Pegg Jr -
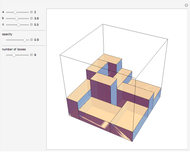 Box Packing
Ed Pegg Jr -
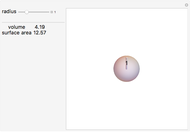 Sphere Volume and Area
Ed Pegg Jr -
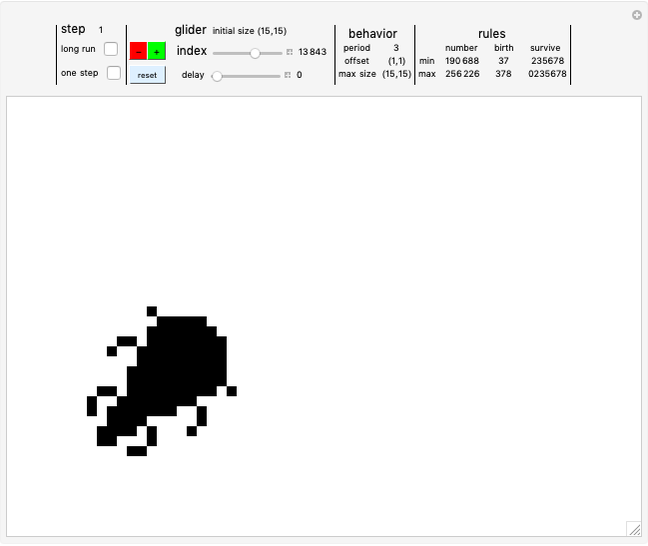 2D CA Glider Database
Ed Pegg Jr -
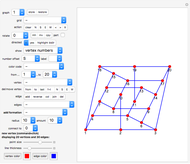 Constructing and Manipulating Graphs
Ed Pegg Jr -
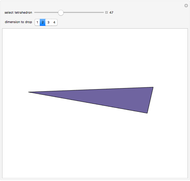 Acute Sets in Euclidean Spaces
Ed Pegg Jr -
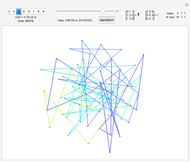
 Moser Spindles, Golomb Graphs and Root 33
Ed Pegg Jr -
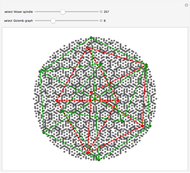
 GL(3,n) Acting on 3D Points
Ed Pegg Jr -
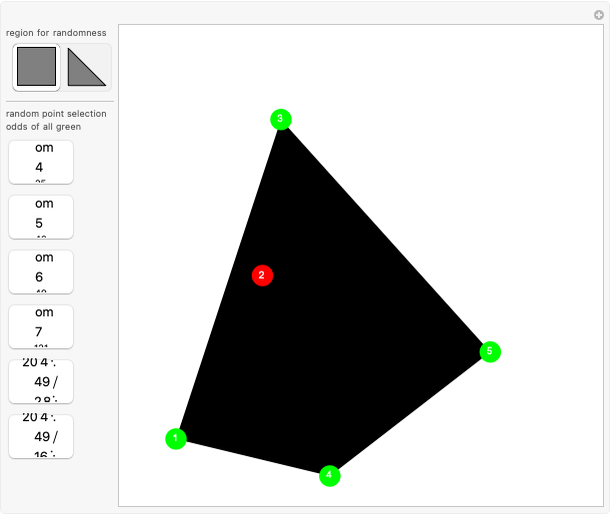 Sylvester's Four-Point Problem
Ed Pegg Jr -
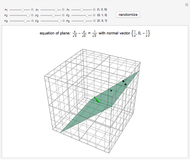 Three Points Determine a Plane
Ed Pegg Jr -
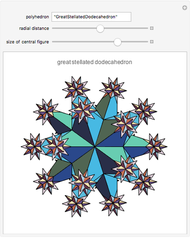 Polyhedra Copied to the Vertices of the Same Kind of Polyhedron
Ed Pegg Jr