Plotting Price Divergences


Requires a Wolfram Notebook System
Interact on desktop, mobile and cloud with the free Wolfram Player or other Wolfram Language products.
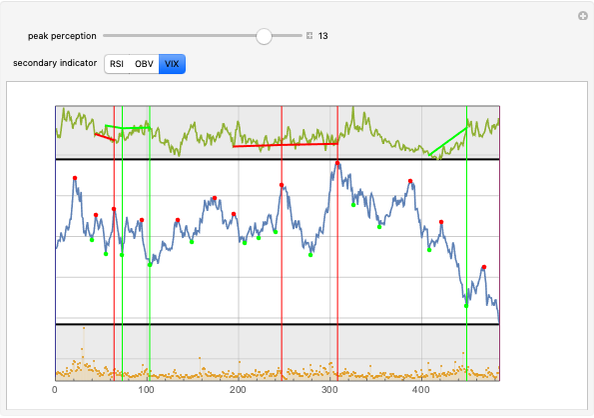
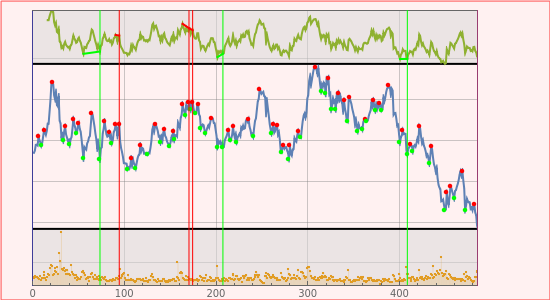
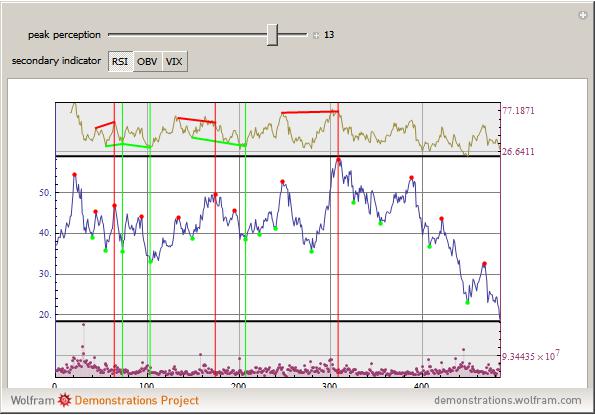
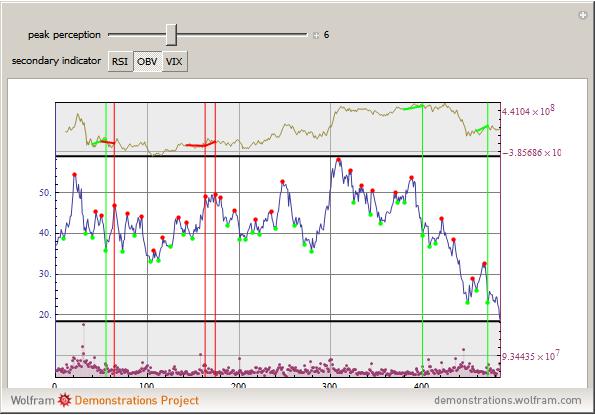
This Demonstration implements divergence tracking between the price of an asset and various technical indicators. The divergence between the price behavior of an asset and the market attitude toward that asset is a powerful predictor of changes in the price trend. Technical analysis involves the development of indicators that are able to give an objective measure of the market's attitude. The theory is that such indicators can be used to predict (or confirm) the changes in trend, and thus offer a kind of crystal ball for the market. In this context, divergence is defined as the failure of an indicator to confirm the price behavior of the underlying asset. For example, if the asset price reaches an all-time high, but the technical indicator fails to confirm this by at least reaching the level attained when the price was at the previous maximum, there is a divergence. A random lognormal price action (middle box) and volume (lower box) are used and technical indicators for it (upper box) are constructed based on (in increasing order of abstraction) the Relative Strength Index (RSI), the On-Balance Volume (OBV), and the Volatility Index (VIX). For each sensitivity setting (i.e., detection of price extrema), the three highest negative and positive divergences are plotted. The vertical green and red lines indicate the point when maximum divergence is reached, while the short sloped lines indicate the strength of the divergence. When sensitivity is high (i.e., almost every price wrinkle is picked up), the various technical indicators are hardly in agreement about the importance of the turning points and are generally rather useless. But as the sensitivity is lowered and the peak detection becomes less noisy, the indicators become more reliable.
Contributed by: Ed Bukhman (March 2011)
Open content licensed under CC BY-NC-SA
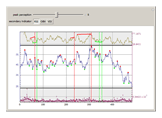
Snapshots
Details
For more infromation on divergence, see Divergence.
For more information on the technical indicators used, see Stockcharts.com.
Permanent Citation
 Stock Price Envelopes
Seth J. Chandler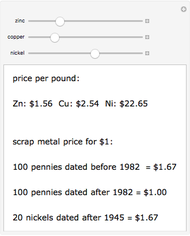 Scrap Metal Price of Coins
Ed Pegg Jr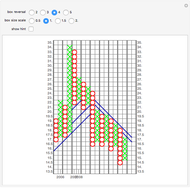 P&F Charts
Ed Bukhman Exploring Minimal Models of the Complexity of Security Prices
Philip Maymin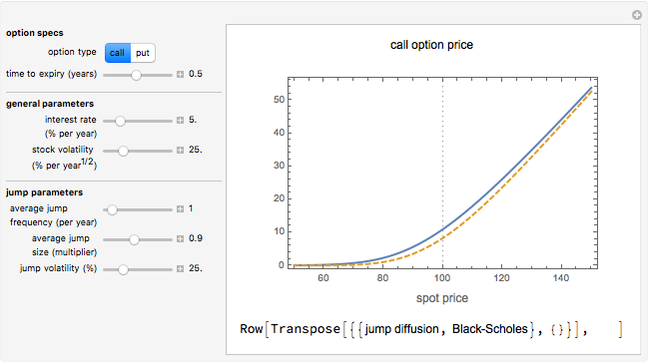 Option Prices in Merton's Jump Diffusion Model
Peter Falloon Minimal Model of Simulating Prices of Financial Securities Using an Iterated Finite Automaton
Philip Maymin Barrier Option Pricing within the Black-Scholes Model
Peter Falloon Pricing Power Options in the Black-Scholes Model
Peter Falloon Price Competition
Loreto Llorente Price-Yield Curve
Fiona Maclachlan