Residue Curves for Different Activity Coefficient Models

Requires a Wolfram Notebook System
Interact on desktop, mobile and cloud with the free Wolfram Player or other Wolfram Language products.
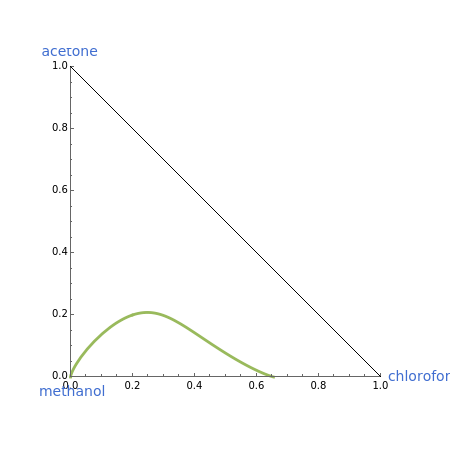
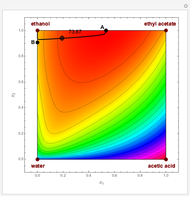
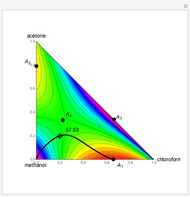
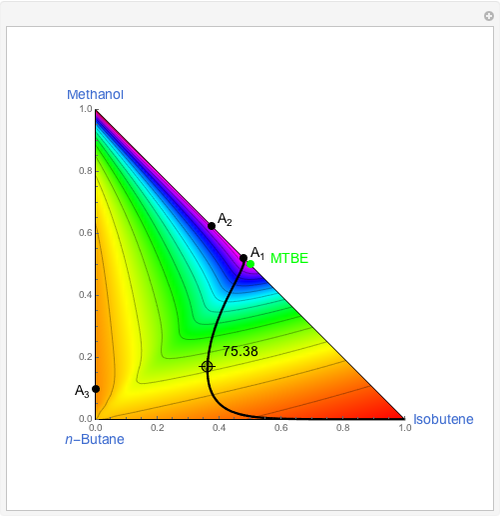
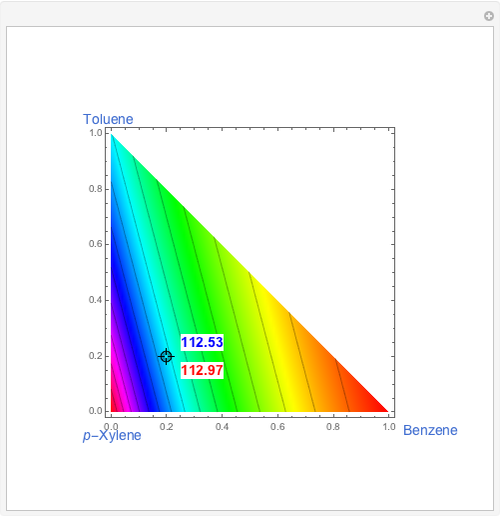
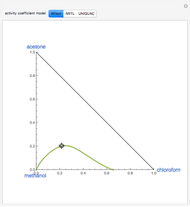
This Demonstration plots the residue curve passing through a location chosen by the user for a ternary mixture of chloroform, acetone, and methanol at 1 atm.
[more]
Contributed by: Housam Binous and Ikbel El Glaoui (March 2011)
Open content licensed under CC BY-NC-SA
Snapshots
Details
For more information, see:
M. F. Doherty and M. F. Malone, Conceptual Design of Distillation Systems, New York: McGraw-Hill, 2001.
Permanent Citation
"Residue Curves for Different Activity Coefficient Models"
http://demonstrations.wolfram.com/ResidueCurvesForDifferentActivityCoefficientModels/
Wolfram Demonstrations Project
Published: March 7 2011
