The Eigenvectors of a Random Graph


Requires a Wolfram Notebook System
Interact on desktop, mobile and cloud with the free Wolfram Player or other Wolfram Language products.
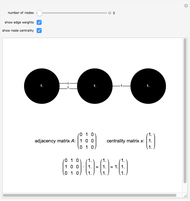
A graph can be represented by an adjacency matrix, with an entry of 1 at position  if the
  node is connected to the
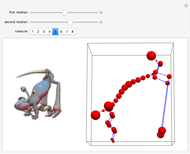
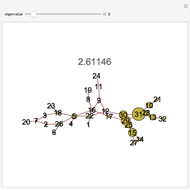
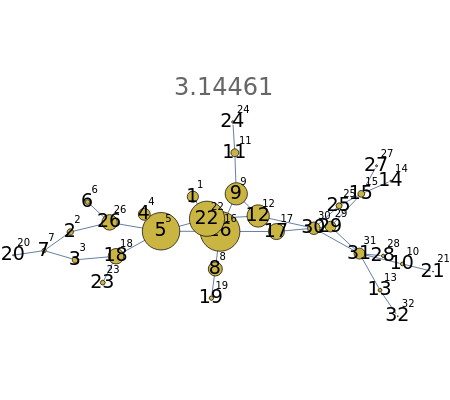
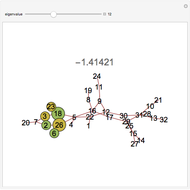
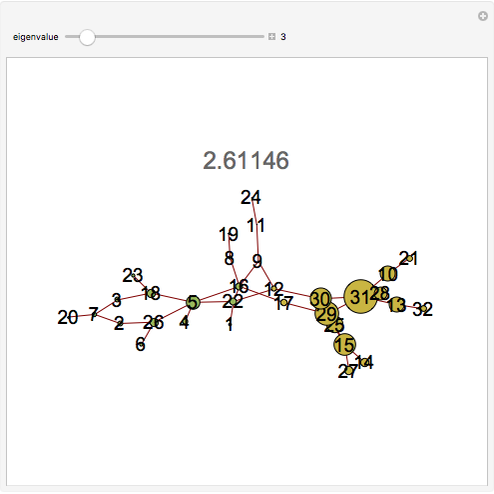
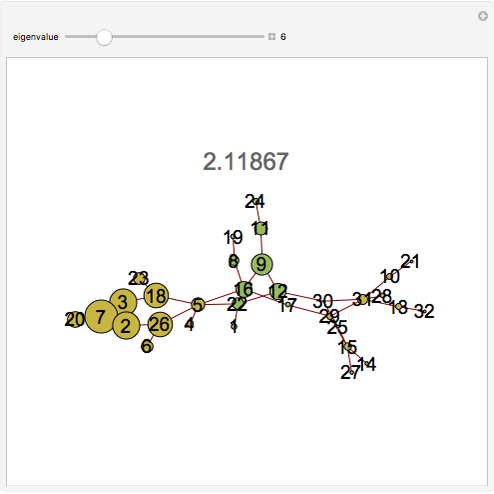
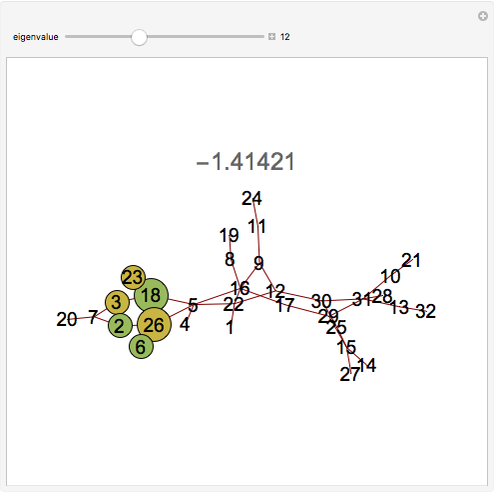
  node, and 0 otherwise. This Demonstration provides a visualization of the eigenvectors of the adjacency matrix of a graph. The eigenvalue is indicated above the graph. The size of the nodes (circles) are proportional to the absolute magnitude of that component of the eigenvector; the eigenvectors are related to the problem of graph partitioning. Yellow nodes indicate positive values and green nodes indicate negative values. The relative sizes of the nodes for a given eigenvalue indicate the relative importance (ranking of those nodes) as well as the community structure of the graph.
Contributed by: Michael Twardos (March 2011)
Open content licensed under CC BY-NC-SA
Snapshots


Details
detailSectionParagraphPermanent Citation
"The Eigenvectors of a Random Graph"
http://demonstrations.wolfram.com/TheEigenvectorsOfARandomGraph/
Wolfram Demonstrations Project
Published: March 7 2011
 Network Centrality Using Eigenvectors
Brian Levinstein Graceful Graphs
Ed Pegg Jr Adjacency Matrices of Manipulable Graphs
Ed Pegg Jr Spectral Properties of Directed Cayley Graphs
Bill Langhoff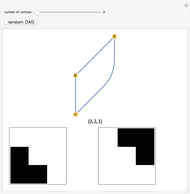 Topological Sort in DAGs
Jaime Rangel-Mondragon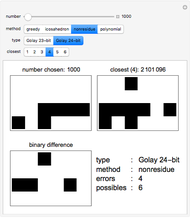 Golay Code
Ed Pegg Jr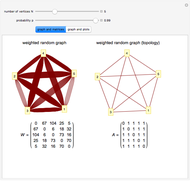 Weighted Random Graph
Tiziano Squartini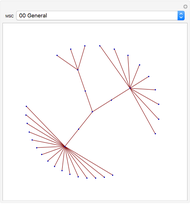 Mathematics Subject Classification Graphs
Michael Schreiber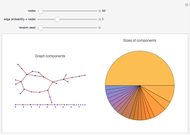 Giant Component in Random Graph
Tommaso Bolognesi Eigenvalues of Random Symmetric Matrices
Stephen Wolfram and Michael Trott