A Signed Rank Test of Hypotheses about a Median


Requires a Wolfram Notebook System
Interact on desktop, mobile and cloud with the free Wolfram Player or other Wolfram Language products.
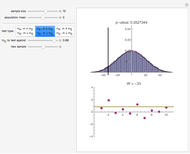
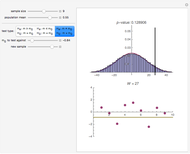
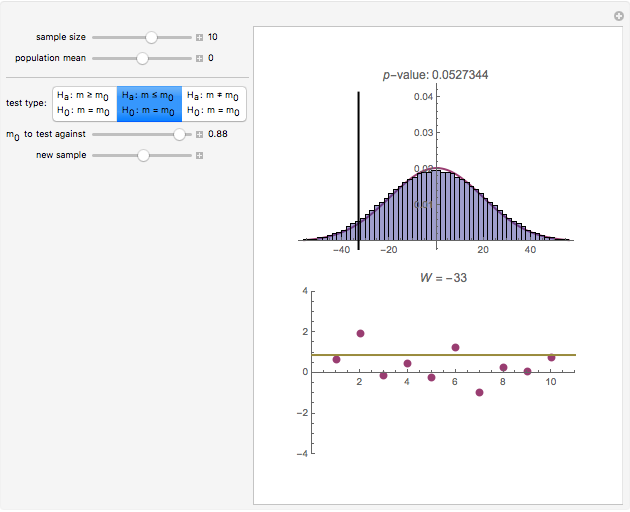
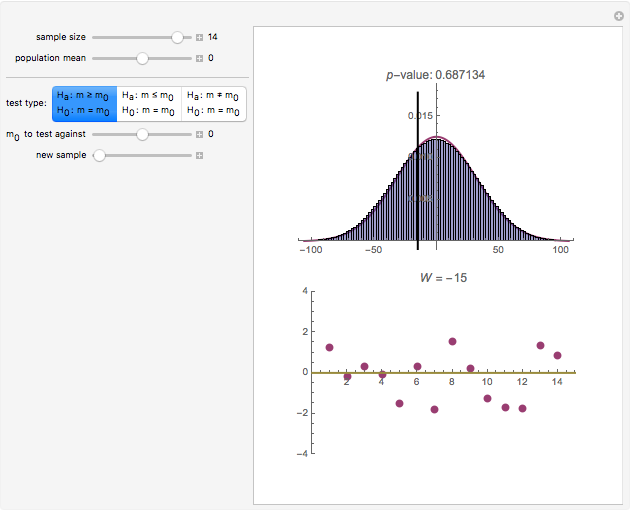
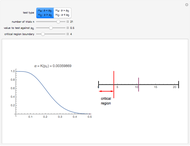
The statistic  on which this test is based is computed by assigning to each value in the dataset its ranking in the list of the absolute differences
  multiplied by the sign of
  (so values below
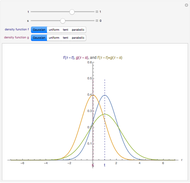
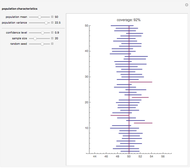
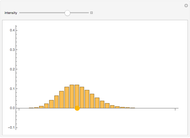
  get assigned a negative rank). These signed ranks are then summed to produce . If the null hypothesis is true, that is, if is the median of the distribution from which the sample comes, then the signs of the differences can be regarded as Bernoulli trials. Using this to assign probabilities to all the possible signed rank sums gives the distribution which is shown in blue in the upper image above. The mean of this distribution is zero and its variance is
  . The purple curve is the density of a normal distribution with this mean and variance, which gives a good approximation to this distribution for all but very small sample sizes.

Contributed by: Chris Boucher (March 2011)
Open content licensed under CC BY-NC-SA
Snapshots


Details
The fact that the signs of the values can be regarded as independent Bernoulli random variables can serve as the basis of a sign test of the hypothesis  . An objection to such a test is that it fails to account for the magnitudes of the differences . Signed rank tests like the one above address this objection. Some tests—generally called "Wilcoxon Signed Rank Tests"—use the statistic obtained by summing only those absolute values
  for which the difference is positive or negative. These two statistics together with the statistic used in this Demonstration are referred to in various places as "Wilcoxon statistics". These tests can be used to assess the statistical evidence for one variable
  being larger than another
  by using the data
  and taking
  .
.
Permanent Citation
 Power of a Test about a Binomial Parameter
Chris Boucher Hypothesis Tests about a Population Mean
Chris Boucher The Power of a Test Concerning the Mean of a Normal Population
Chris Boucher Predictive Scores and Ultimate Test Passage
Seth J. Chandler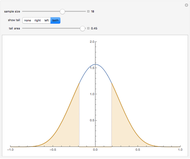 The r-Distribution
Chris Boucher Confidence and Prediction Bands
Chris Boucher Distributions of Order Statistics
Chris Boucher Descriptions of Univariate Data
Chris Boucher Visualizing the Exact Median Rank
Frederick Wu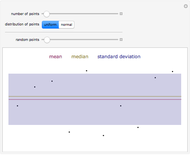 Mean, Median, and Standard Deviation for Random Values
Stephen Wolfram
-
Hypothesis Tests about a Population Mean
Chris Boucher -
 Fair Sharing of an Equilateral Triangular Pizza
Chris Boucher -
 Using Rule 30 to Generate Pseudorandom Real Numbers
Chris Boucher -
 Circumscribing Polygons
Chris Boucher -
 Nine-Point Circle
Chris Boucher -
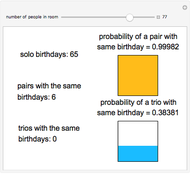 The Birthday Problem
Chris Boucher -
 Convolutions of Shifted Densities
Chris Boucher -
 Geometric Distribution
Chris Boucher -
 How Old Would You Be on Another Planet (or Pluto)?
Chris Boucher -
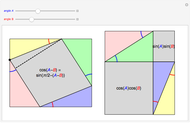 Difference Formula for Cosine
Chris Boucher -
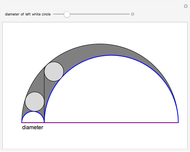 The Arbelos
Chris Boucher -
 Confidence Intervals for a Mean
Chris Boucher -
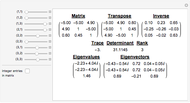 3x3 Matrix Explorer
Chris Boucher -
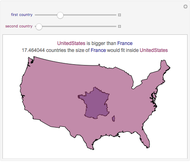 Which Country Is Bigger?
Chris Boucher -
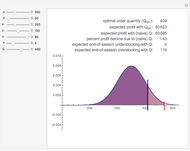 Capacity Planning for Short Life Cycle Products: The Newsvendor Model
Chris Boucher -
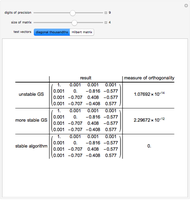 Numerical Instability in the Gram-Schmidt Algorithm
Chris Boucher -
 Poisson Distribution
Chris Boucher -
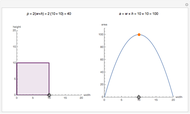 Maximizing the Area of a Rectangle with Fixed Perimeter
Chris Boucher -
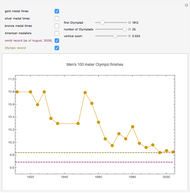 Olympic Medal Times in the Men's 100 Meter
Chris Boucher -
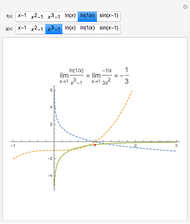 L'Hospital's Rule for 0/0 Forms
Chris Boucher