Power of a Test about a Binomial Parameter

Requires a Wolfram Notebook System
Interact on desktop, mobile and cloud with the free Wolfram Player or other Wolfram Language products.
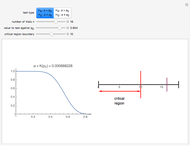
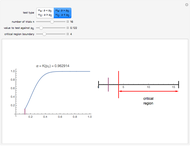
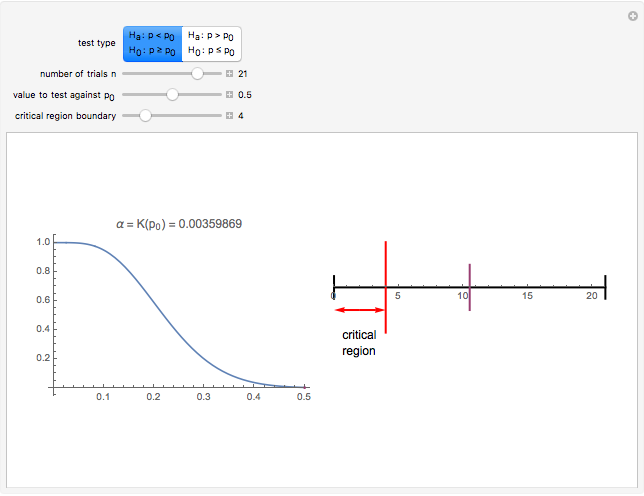
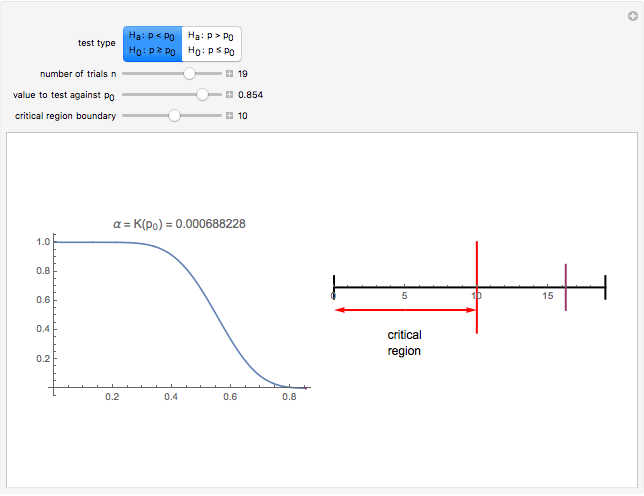
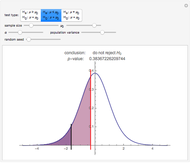
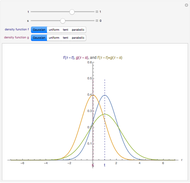
The left plot shows the power function of the selected test with the value of  marked in purple. The power function is a function of the true value of the parameter
  . Its value at
  is called the significance of the test. The right image shows the critical region as a subset of the range of the test statistic. The expected value of the test statistic if
  ,
,  is marked in purple.
Contributed by: Chris Boucher (March 2011)
Open content licensed under CC BY-NC-SA
Snapshots


Details
To test the hypothesis  or the hypothesis
  about a Bernoulli parameter
  , it is decided that if the number of successes in
  independent trials is above (for the first test) or below (for the second test) a certain threshold, then the hypothesis will be accepted. This threshold is the boundary of what is called the critical region—whether the number of successes falls in this region determines the outcome of the test. The probability that the number of successes falls in the critical region is a function of the true value of
  . In the case of the test
  , the power function gives this probability for
  . If
. If  the number of successes falls outside the critical region, then a type II error (false negative) occurs. The power function gives the opposite of this probability, that is, for each value of
  covered by
  , the power function gives the probability that the test does not yield a false negative.
Permanent Citation
 Hypothesis Tests about a Population Mean
Chris Boucher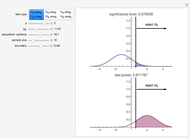 The Power of a Test Concerning the Mean of a Normal Population
Chris Boucher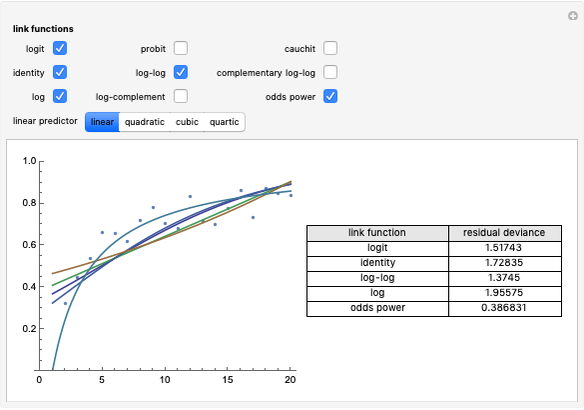 Comparing Binomial Generalized Linear Models
Darren Glosemeyer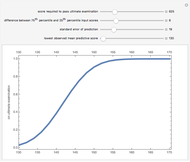 Predictive Scores and Ultimate Test Passage
Seth J. Chandler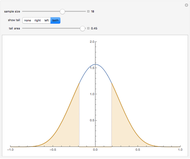 The r-Distribution
Chris Boucher Distributions of Order Statistics
Chris Boucher A Signed Rank Test of Hypotheses about a Median
Chris Boucher Simultaneous Confidence Interval for the Weibull Parameters
Michail Bozoudis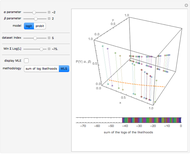 Maximum Likelihood Estimators for Binary Outcomes
Seth J. Chandler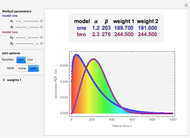 Comparing and Weighting Two Weibull Models
Frederick Wu
-
Hypothesis Tests about a Population Mean
Chris Boucher -
 Fair Sharing of an Equilateral Triangular Pizza
Chris Boucher -
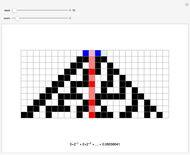 Using Rule 30 to Generate Pseudorandom Real Numbers
Chris Boucher -
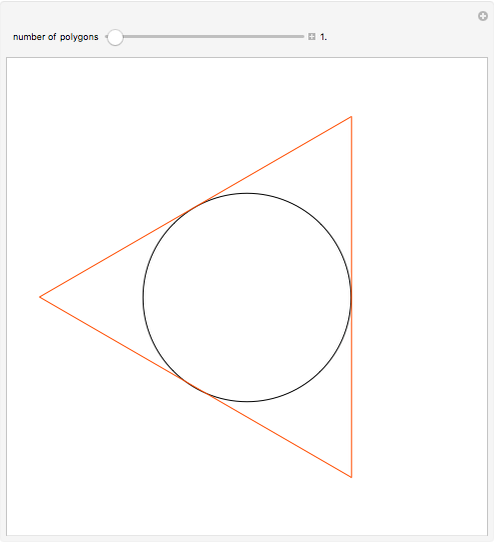 Circumscribing Polygons
Chris Boucher -
 Nine-Point Circle
Chris Boucher -
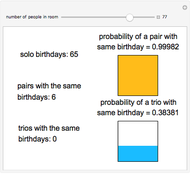 The Birthday Problem
Chris Boucher -
 Convolutions of Shifted Densities
Chris Boucher -
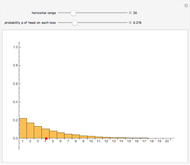 Geometric Distribution
Chris Boucher -
 How Old Would You Be on Another Planet (or Pluto)?
Chris Boucher -
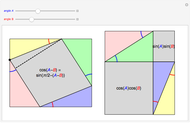 Difference Formula for Cosine
Chris Boucher -
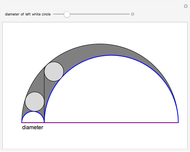 The Arbelos
Chris Boucher -
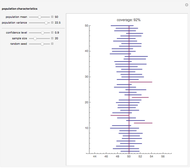 Confidence Intervals for a Mean
Chris Boucher -
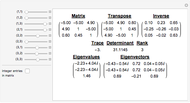 3x3 Matrix Explorer
Chris Boucher -
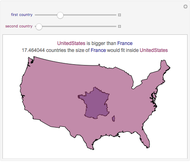 Which Country Is Bigger?
Chris Boucher -
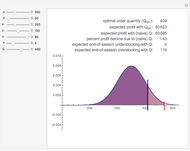 Capacity Planning for Short Life Cycle Products: The Newsvendor Model
Chris Boucher -
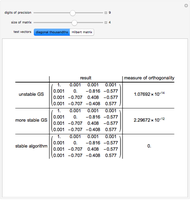 Numerical Instability in the Gram-Schmidt Algorithm
Chris Boucher -
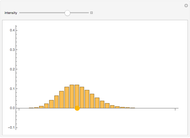 Poisson Distribution
Chris Boucher -
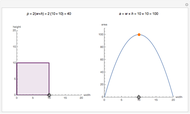 Maximizing the Area of a Rectangle with Fixed Perimeter
Chris Boucher -
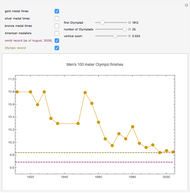 Olympic Medal Times in the Men's 100 Meter
Chris Boucher -
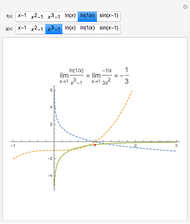 L'Hospital's Rule for 0/0 Forms
Chris Boucher