Cournot and Stackelberg Equilibria and Best Responses

Requires a Wolfram Notebook System
Interact on desktop, mobile and cloud with the free Wolfram Player or other Wolfram Language products.
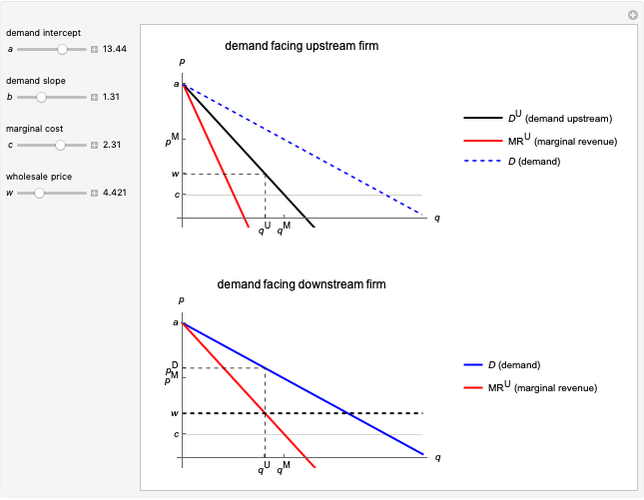
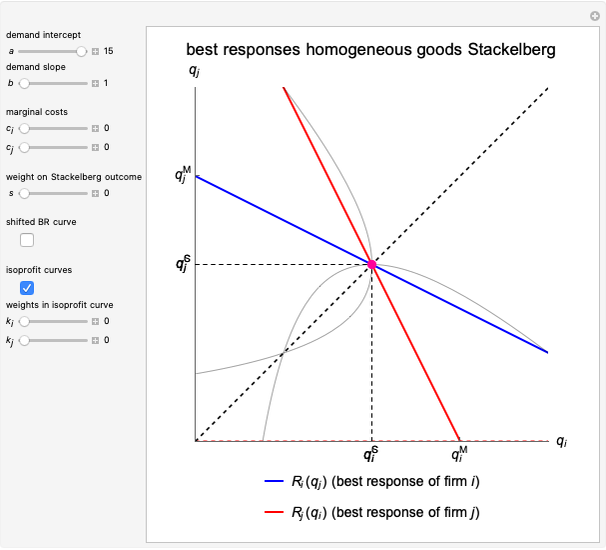
This Demonstration illustrates a number of features of the homogeneous goods Cournot and Stackelberg duopoly model [1, Chapter 4] as opposed to the Singh and Vives model of product differentiation under Bertrand competition [2], which is treated in the Duopoly Competition with Differentiated Products Demonstration. The market has inverse demand function  and the firms produce at constant marginal costs
  and
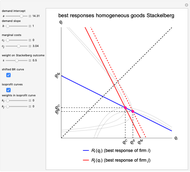
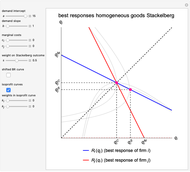
and  , respectively. The graph illustrates the best response curves of firm
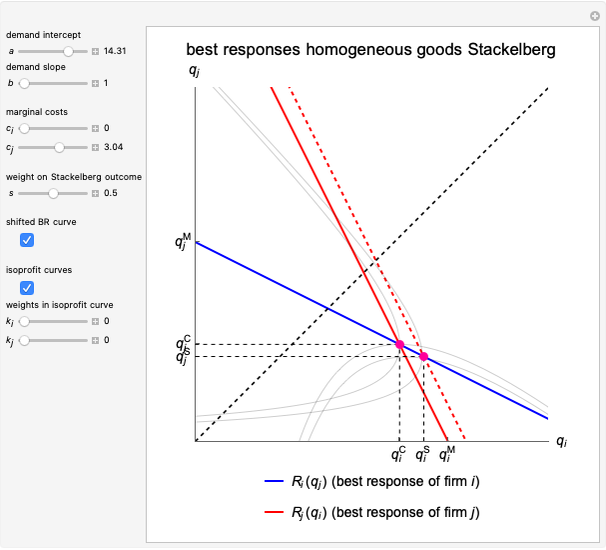
  (blue, Stackelberg dotted) and firm
  (red). The intersections are the Cournot equilibrium point and the Stackelberg equilibrium point. Note that the Stackelberg quantity equilibria are always below the Cournot equilibria and coincide when the weight
  on the Stackelberg outcome is zero. The demand parameters are
  (demand intercept) and
  (demand slope). The parameters
  and
and  are the weights on the monopoly points in the isoprofit curves. That is, for
  , the graph shows the isoprofit curve reached by firm
  in the Cournot equilibrium. For
  , the graph shows the isoprofit curve for firm
  in the monopoly point, the point preferred by firm
  . The slider
  does the same for firm
  .
.
Contributed by: Flavio Toxvaerd (August 2022)
(University of Cambridge)
Open content licensed under CC BY-NC-SA
Snapshots


Details
Reference
[1] P. Belleflamme and M. Peitz, Industrial Organization: Markets and Strategies, 2nd ed., Cambridge, UK: Cambridge University Press, 2015.
[2] N. Singh and X. Vives, "Price and Quantity Competition in a Differentiated Duopoly," The RAND Journal of Economics, 15(4), 1984 pp. 546–554.
Permanent Citation
 Best Response Learning in a Cournot Framework
Clemens Fiedler Cournot Competition with Two Firms
Kazuki Kumashiro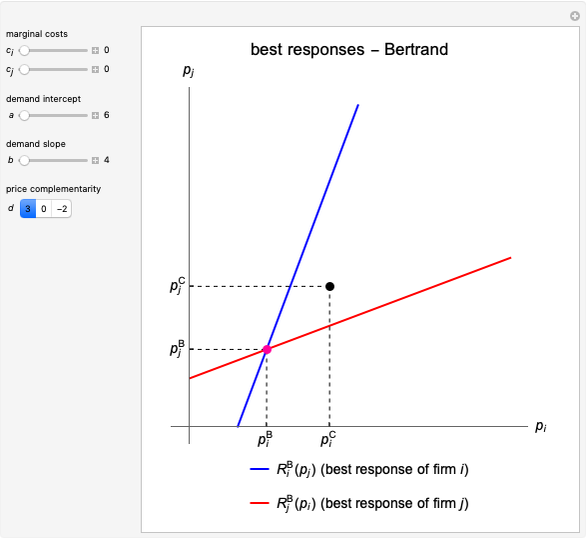 Duopoly Competition with Differentiated Products
Flavio Toxvaerd Monte Carlo Simulation of Retirement Savings with Variable Annual Return
Paul Savory (University of Nebraska-Lincoln) Valuation and Management of Bonds
Charles N. Bagley (University of Massachusetts at Amherst) Maximizing Profit in Ore Mining
Housam Binous and Ahmed Bellagi Basel II Capital Adequacy: Internal Ratings-Based (IRB) Approach
Poomjai Nacaskul Monopolistic Competition with a Homogeneous Product
Christos Papahristodoulou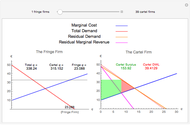 Imperfect Cartel
Christos Papahristodoulou Dynamic Profit Maximization for a Monopolist
Christos Papahristodoulou