Exploring the Tails of the Normal Distribution


Requires a Wolfram Notebook System
Interact on desktop, mobile and cloud with the free Wolfram Player or other Wolfram Language products.
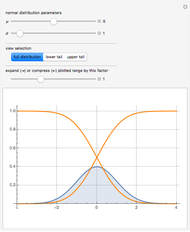
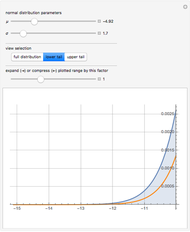
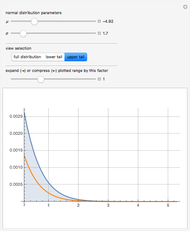
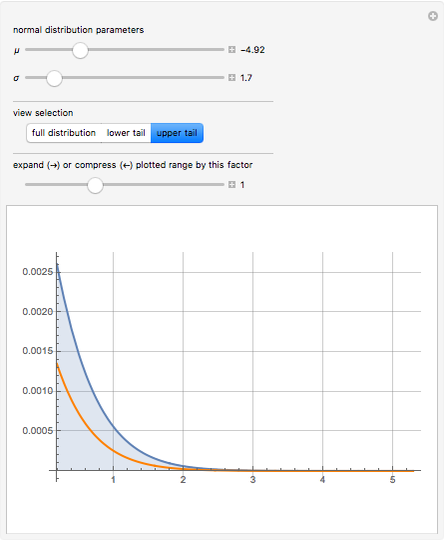
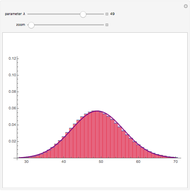
This Demonstration allows you to estimate the area under the tails of the normal distribution curve. Reading the value of the cumulative distribution function (orange curve) for a specific  value gives the area under the probability distribution function (blue curve) to the left (for the lower tail) or to the right (upper tail) of the
  value. The probability distribution function can be adjusted to have values for the mean
  and standard deviation
  in the ranges (-10, 10) and (0.1, 15), respectively.
Contributed by: Joe O'Hara (September 2007)
Open content licensed under CC BY-NC-SA
Details
In the "full distribution" view, the plotted range is set at  . This range can be expanded or compressed by using the bottom slider. In the "lower tail" view, the plotted range is set at (
 ,
,  ) to give a view of the tail beyond the typically viewed
  point. Similarly, for the "upper tail" view, the plotted range is set at (
 ,
,  ). The ranges in these tail views can also be expanded or compressed to home in on the portions of the curves of interest.
Snapshots


Permanent Citation
 Normal Approximation to a Poisson Random Variable
Chris Boucher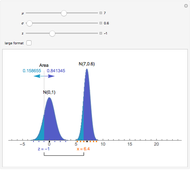 Area of a Normal Distribution
Eric Schulz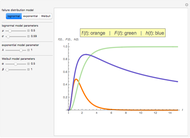 Reliability Distributions
Joe O'Hara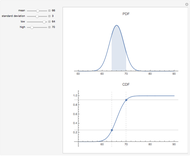 Connecting the CDF and the PDF
Roger J. Brown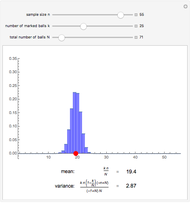 The Hypergeometric Distribution
Chris Boucher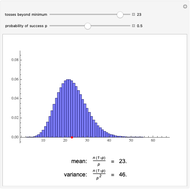 The Negative Binomial Distribution
Chris Boucher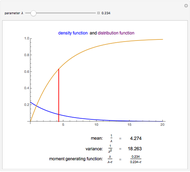 The Exponential Distribution
Chris Boucher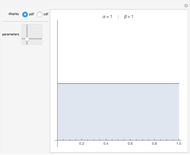 Beta Distribution
Fiona Maclachlan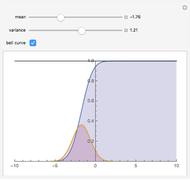 Logistic Sigmoid Market Model
Michael Schreiber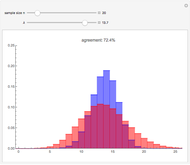 Binomial Approximation to a Poisson Random Variable
Chris Boucher