NPV and its Contributions


Requires a Wolfram Notebook System
Interact on desktop, mobile and cloud with the free Wolfram Player or other Wolfram Language products.
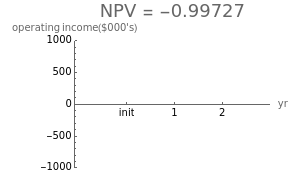
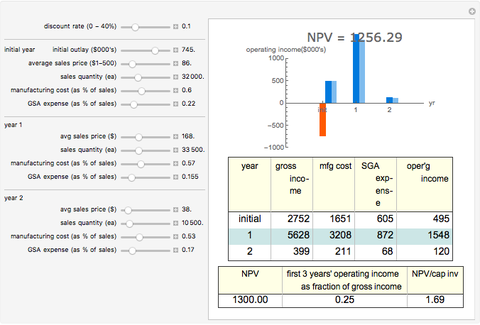
Net Present Value (NPV), the sum of discounted cash flows, is an approach used to judge whether to undertake a new product-commercialization project and/or a way to compare the relative value of proposed projects competing for the same resources. The higher the NPV, the better return the project has for the business. This Demonstration allows for the quick computation and visualization of NPV over a three-year period.
Contributed by: Joe O'Hara (March 2011)
Based on a program by: Fiona Maclachlan
Open content licensed under CC BY-NC-SA
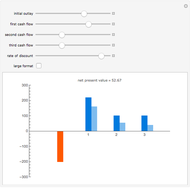
Snapshots


Details
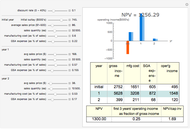
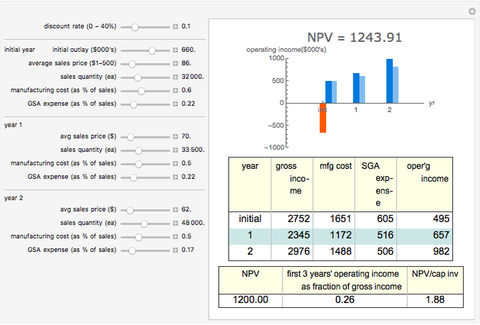
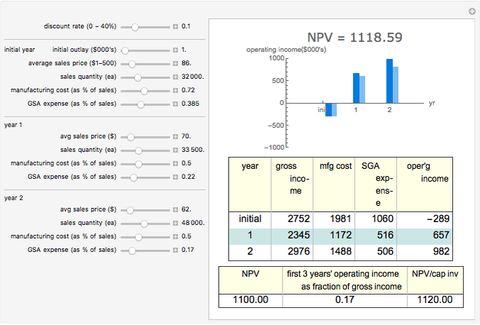
The discount rate is a settable quantity ranging from 0 to 0.4 (40%). This Demonstration assumes that there is an initial outlay of money of from 0 to $1 million (e.g., for the purchase of capital equipment needed to produce a new product), followed by sales of the product. The gross sales revenue, or gross income, minus the sum of the costs to manufacture the product and the General, Sales and Administrative (GSA) expenses is the operating income from the product project and is plotted on the bar chart. The gross sales revenue for any period is the product of the average sales price of the product and the quantity of product sold during that period. These two quantities are controlled by the first two sliders in each year's area. Since costs to manufacture, develop, sell and administer new products typically grow with the volume of product sold, those costs are shown as fractions of gross revenue and are settable by the last pair of sliders for each year. Note that this Demonstration allows an average sales price of from $1 to $500 per unit and that the number of units sold per year ranges from 1 to 100,000. The lower table repeats the NPV and two common metrics associated with the commercialization project's projected performance: (1) the ratio of the sum of the first three years' operating income to the same period's gross revenue and (2) the ratio of the NPV to the capital outlay. It should also be noted that an estimate for the three-year Internal Rate of Return (IRR) can be gotten by manipulating the discount rate slider to a value such that the NPV goes to zero. This discount rate value may then be compared to an "hurdle rate" that each business generates for different types of projects to give another view of the viability of pursuit of the project. (In some cases, the IRR can exceed 40%. In these cases, manipulating the discount rate slider, which has an upper limit of 40%, will not bring the NPV to zero.)
Permanent Citation
"NPV and its Contributions"
http://demonstrations.wolfram.com/NPVAndItsContributions/
Wolfram Demonstrations Project
Published: March 7 2011
 Net Present Value
Fiona Maclachlan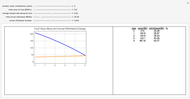 Fund Drawdown Simulation
Joe O'Hara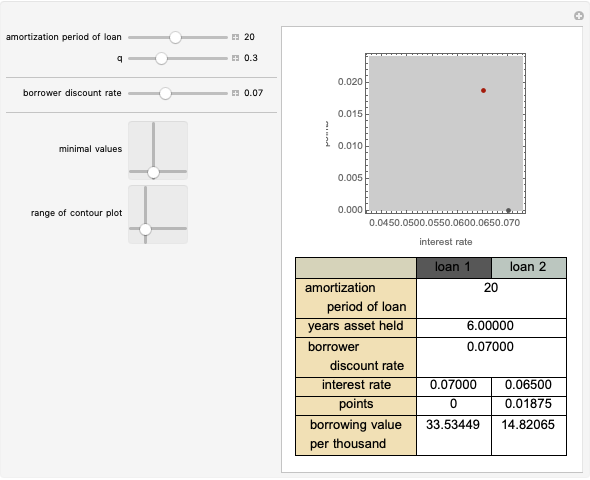 Pay the Points?
Seth J. Chandler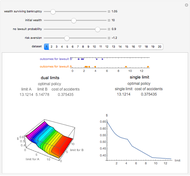 The Efficient Dual-Limit Liability Insurance Contract
Seth J. Chandler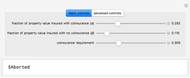 Property Coinsurance
Seth J. Chandler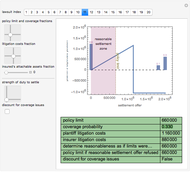 The Duty to Settle
Seth J. Chandler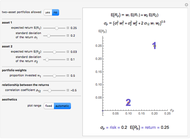 Two-Asset Markowitz Feasible Set
Jim R Larkin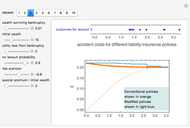 Efficient Single Limit Liability Insurance
Seth J. Chandler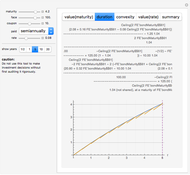 Valuation and Management of Bonds
Charles N. Bagley (University of Massachusetts at Amherst)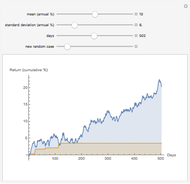 Brownian Motion Path and Maximum Drawdown
Neil Chriss