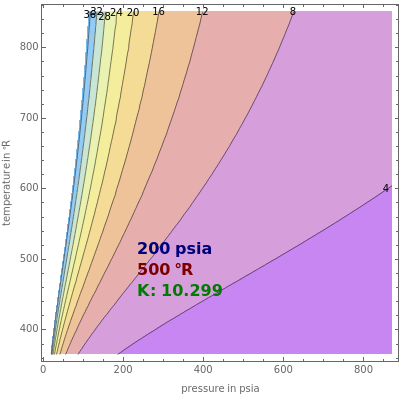
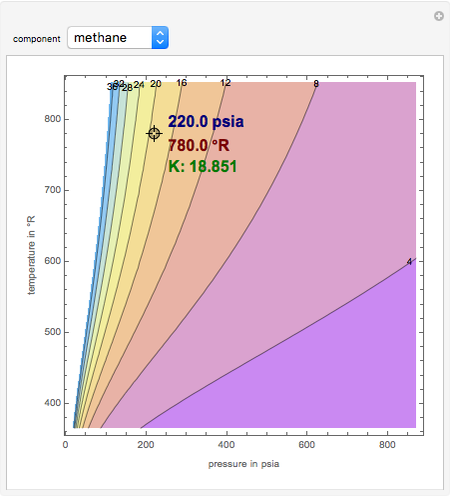
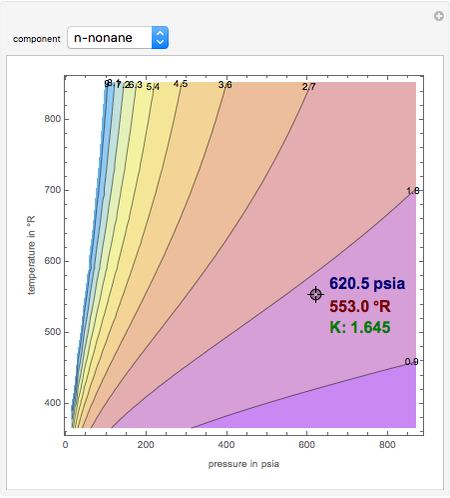
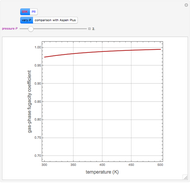
K-value of Several Hydrocarbons versus Temperature and Pressure
Initializing live version


Requires a Wolfram Notebook System
Interact on desktop, mobile and cloud with the free Wolfram Player or other Wolfram Language products.
This Demonstration shows the contour plot of  versus temperature expressed in °R and pressure expressed in psia, where
  and
and  are the mole fractions of component
  in the liquid and vapor phases, respectively. For many systems,
  -values are approximately independent of composition and we have
  .
.


Contributed by: Housam Binous and Ahmed Bellagi (March 2011)
Open content licensed under CC BY-NC-SA
Snapshots

Details
[1] M. L. McWilliams, "An Equation to Relate K-Factors to Pressure and Temperature," Chemical Engineering, 80(25), 1973 p. 138.
Permanent Citation
Related Demonstrations
More by Author
 Performance of CSTR and Plug Flow Reactors versus Temperature
Housam Binous and Ahmed Bellagi Vapor-Phase Solubility of Decane in Nitrogen as Functions of Temperature and Pressure
Housam Binous, Brian G. Higgins, Nadhir A. Al-Baghli, and Ahmed Bellagi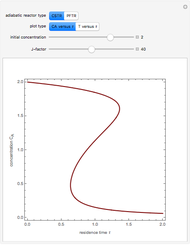 Variation of Temperature and Concentration versus Residence Time for Adiabatic Reactors
Housam Binous and Ahmed Bellagi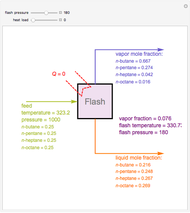 Flash Distillation of a Mixture of Four Hydrocarbons
Housam Binous, Naim Faqir, and Brian G. Higgins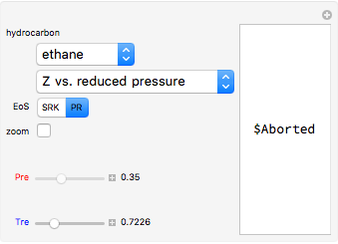 The Law of Corresponding States for Hydrocarbons: the Two-Phase Region
Housam Binous, Nayef M. Alsaifi, Ali Kh. Al-Matar, and Brian G. Higgins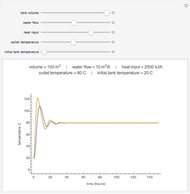 Proportional Temperature Control
Jeff Bryant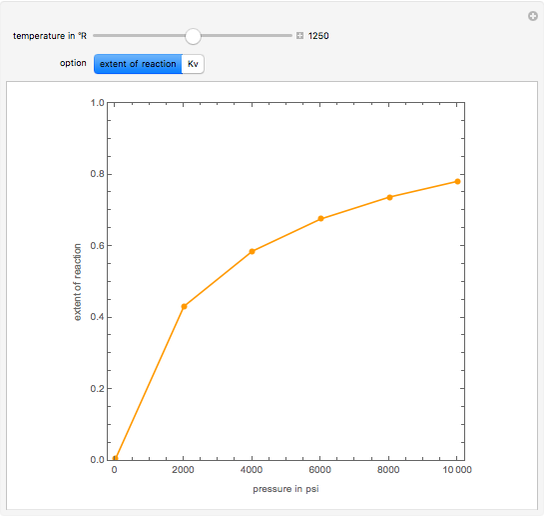 High-Pressure Chemical Equilibrium
Housam Binous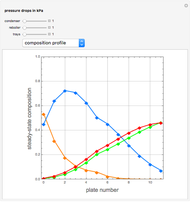 Distillation Column Calculation Incorporating Pressure Drop Effect
Housam Binous, Naim Faqir, and Brian G. Higgins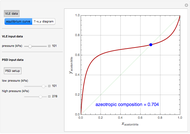 Separating Binary Azeotropes Using Pressure Swing Distillation
Housam Binous and Brian G. Higgins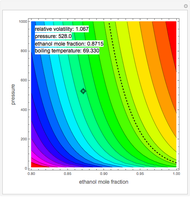 Locus of a Pressure-Sensitive Binary Azeotrope
Housam Binous and Brian G. Higgins
-
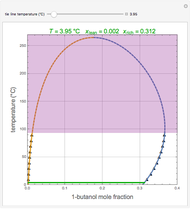 Liquid-Liquid Equilibrium for the 1-Butanol-Water System
Ahmed Bellagi -
 Temperature Dependence of Dehydrogenation of Ethyl Benzene to Styrene
Ahmed Bellagi -
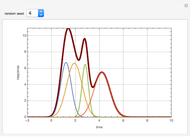 Deconvolution of a Chromatogram
Ahmed Bellagi -
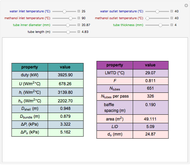 Design of a Shell and Tube Heat Exchanger
Ahmed Bellagi -
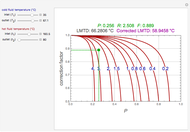 Correction Factor for Shell and Tube Heat Exchanger
Ahmed Bellagi -
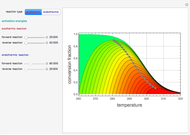 Contour Plots for Reaction Rates
Ahmed Bellagi -
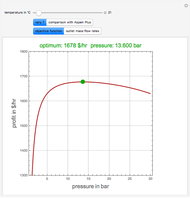 Optimal Conditions for CO2/n-Hexane Flash Separation
Ahmed Bellagi -
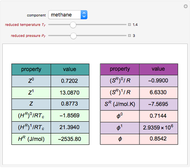
 Residual Functions for the SRK and PR Equations of State
Ahmed Bellagi -
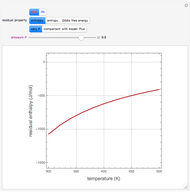
 Gas-Phase Fugacity Coefficients for Propylene
Ahmed Bellagi -
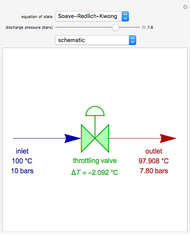 Operation of a Throttling Valve
Ahmed Bellagi -
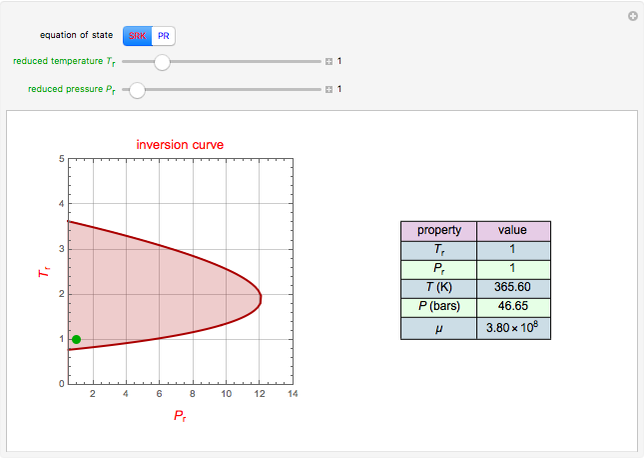 Joule-Thomson Inversion Curves for Soave-Redlich-Kwong (SRK) and Peng-Robinson (PR) Equations of State
Ahmed Bellagi -
 Lee-Kesler Generalized Correlations for Gases
Ahmed Bellagi -
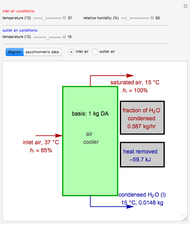 Operation of an Air Conditioner
Ahmed Bellagi -
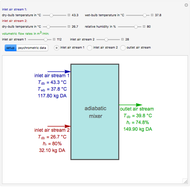 Adiabatic Mixing of Two Moist Air Streams
Ahmed Bellagi -
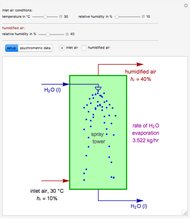 Adiabatic Humidification
Ahmed Bellagi -
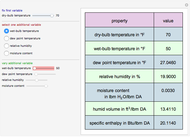 Psychrometric Data Calculator in English Engineering Units
Ahmed Bellagi -
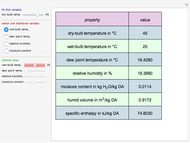 Psychrometric Data Calculator in SI Units
Ahmed Bellagi -
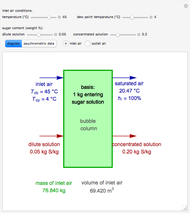 Concentration of Sugar Solution in a Bubble Column
Ahmed Bellagi -
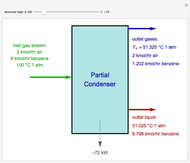 Operation of a Partial Condenser
Ahmed Bellagi -
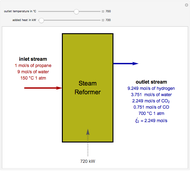 Steam Reforming of Propane
Ahmed Bellagi